Dual Moving Average Intelligent Tracking Strategy

Overview
The Dual Moving Average Intelligent Tracking strategy utilizes the dual moving average indicator to track short-term and medium-to-long term price trends. Visual aids in the form of color changes and line width transformations help traders intuitively judge market trends and make trading decisions accordingly. The strategy offers high flexibility through customizable parameters, making it suitable for algorithmic trading by hedge funds and private equity funds with some technical sophistication.
Strategy Logic
The core of the Dual Moving Average Intelligent Tracking strategy lies in using fast and slow moving averages to generate trading signals. Specifically, the fast moving average tracks short-term price fluctuations, while the slow one reflects medium-to-long term trends. Additionally, the strategy presents the baseline moving average in different colors based on three schemes (Crossover, Direction, and Composite) to assist in determining market trends. Long positions are initiated when the fast MA crosses over the slow MA, and exits when the fast MA crosses below. The length of the baseline MA is customizable, and the color scheme can be switched among the three options to allow a high degree of customization.
Advantage Analysis
The biggest advantage of this strategy is the combination of the dual moving average indicator and visual aids using colors to judge market trends, making it simple and straightforward to operate. Next, the customizable parameters empower users to tailor the strategy based on their trading preferences and market conditions, enabling efficient backtesting and live trading. The choice of color schemes can also cater to different users' visual and operational habits. Lastly, the dual MAs are responsive in tracking price changes, allowing the strategy to capitalize on short-term price swings.
Risk Analysis
Despite its conspicuous advantages, the strategy also carries some potential risks. The dual MAs are highly sensitive to price fluctuations, which may generate false signals and lead to overtrading. While flexibility rises with customizable parameters, difficulty in parameter tuning also increases, and inappropriate parameter combinations will undermine profitability. Hedge funds and private equity funds need to be wary of chasing trends and over leveraging. Finally, users require sufficient comprehension of dual MAs and moving averages to apply the strategy appropriately.
Optimization Directions
Several optimization pathways exist for the strategy. Firstly, additional indicators can be introduced to filter misleading signals, like KDJ for overbought-oversold levels and MACD for profitable pullbacks. Secondly, a parameter optimization model can be constructed to aid parameter selection. Thirdly, machine learning models can be leveraged to forecast price changes and assist trend judgement. Fourthly, a stop loss mechanism can be instituted to automatically exit positions when losses reach preset thresholds. These optimizations can enhance the strategy's stability and profitability.
Conclusion
On the whole, the Dual Moving Average Intelligent Tracking Strategy is a simple yet flexible, advantage-rich high frequency algorithmic trading approach. It cleverly fuses dual moving averages and visual aids to determine market trends and capitalize on short-term swings. Meanwhile, its high customizability makes it suitable for optimization and parameter tuning by knowledgeable investors and funds before real-world application. Nonetheless, risks like tuning difficulty and misleading signals should be heeded. Further optimizations around additional indicators, parameter selection models, price change forecasts, etc. can unlock greater potential. Hence, this strategy warrants in-depth exploration.
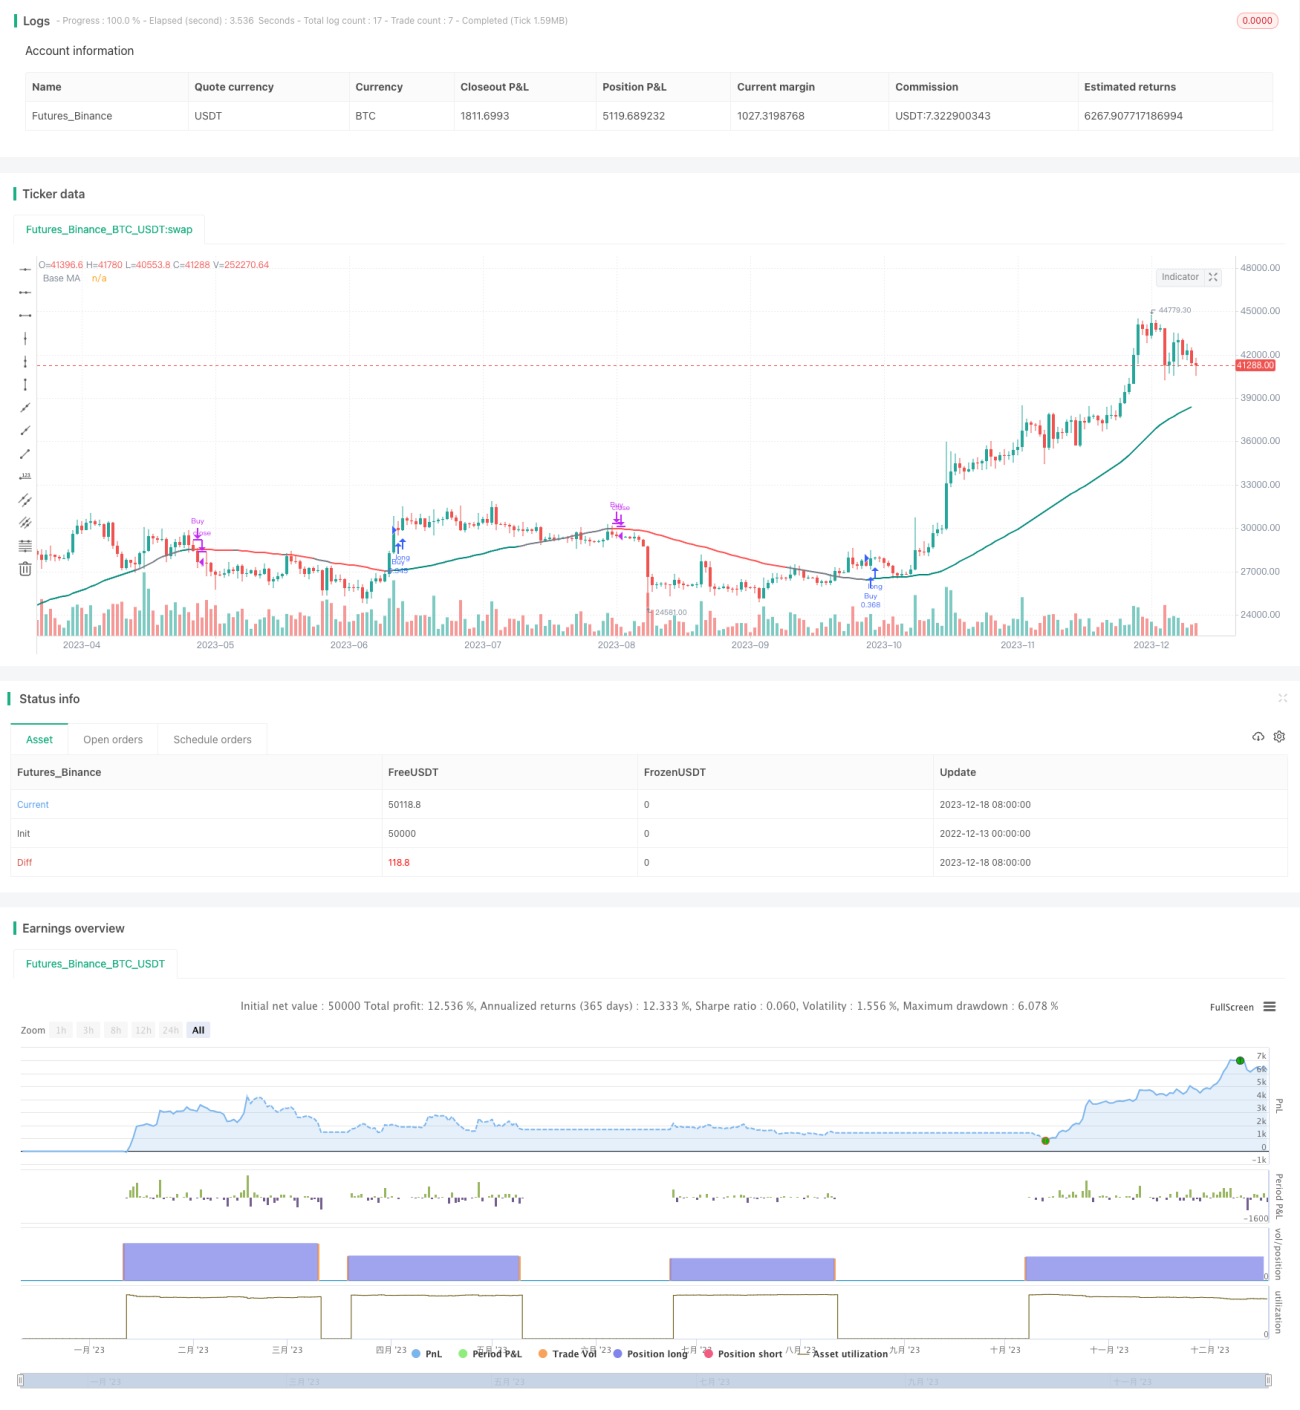
/*backtest
start: 2022-12-13 00:00:00
end: 2023-12-19 00:00:00
period: 1d
basePeriod: 1h
exchanges: [{"eid":"Futures_Binance","currency":"BTC_USDT"}]
*/

// © Julien_Eche

//@version=5
strategy("Smart MA Strategy", shorttitle="Smart MA Strategy", overlay=true, default_qty_type=strategy.percent_of_equity, default_qty_value=20)- 1