RSI Trading Strategy

Overview
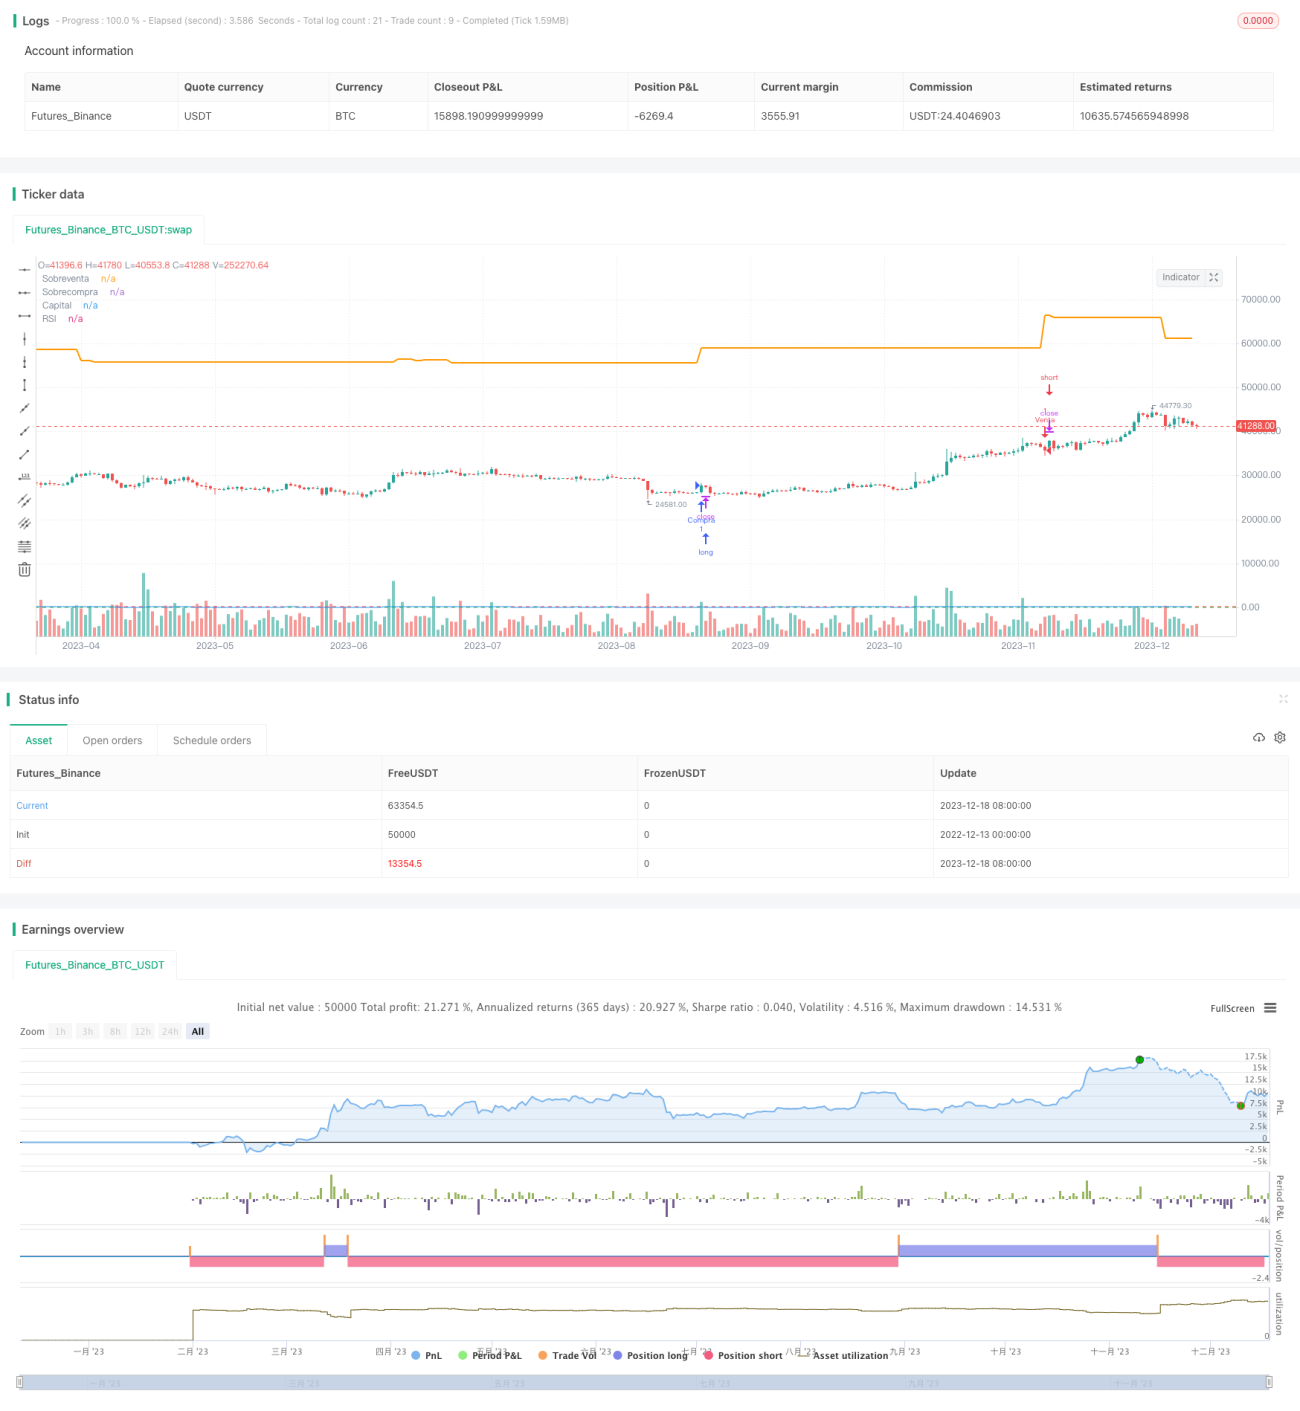
This is an automated cryptocurrency trading strategy based on the Relative Strength Index (RSI) indicator. It calculates the RSI metric of BTC/USDT to set overbought and oversold thresholds for generating buy and sell signals, enabling automated long and short positions.
Strategy Principle
The core principle of this strategy is to use the RSI indicator to judge overbought and oversold market conditions. The RSI reflects the speed and magnitude of price changes with a range of 0-100. When RSI>70 the market is overbought and selling should be chosen; when RSI<30 the market is oversold and buying should be chosen.
Specifically, the strategy calculates 14-period RSI values and sets oversold line at 30 and overbought line at 70. When RSI crosses over the oversold line 30 upwards a buy signal is generated; when RSI crosses down the overbought line 70 a sell signal is generated. These two signals form long and short decisions.
In addition, protective stop losses are built in when RSI crosses back over the overbought and oversold lines for closing positions. This allows locking in profits and reducing losses.
Advantage Analysis
The biggest advantage of this strategy is using the RSI indicator to judge overbought/oversold market conditions, which is a proven and reliable trading principle. RSI can capture price reversal opportunities and provide informative signals for our decisions.
Also, the adjustable parameters provide flexibility. We can optimize the RSI period and threshold values based on changing market dynamics to improve performance. This gives us sufficient adaptivity.
Lastly, the protective stop loss mechanism effectively controls risks, also a major highlight of the strategy.
Risk Analysis
The biggest risk is that RSI signals may provide incorrect trading guidance. When there are abnormal price penetrations, RSI cannot perfectly determine overbought/oversold levels, which can lead to trading losses.
Additionally, the preset overbought/oversold thresholds may not suit all market conditions. We need to incorporate more indicators to confirm RSI signals and avoid false signals.
Finally, stop loss positioning also introduces some risks. We have to dynamically adjust stop levels based on different markets, otherwise stops may trigger prematurely or have too large loss size. This requires continuous testing and tuning.
Optimization Directions
The strategy can be improved in the following aspects:
-
Optimize RSI parameters like period length and threshold values to find best combination
-
Incorporate more indicators like candlestick patterns and MACD to form more reliable trade signals
-
Refine capital management like adaptive stop loss levels and dynamic position sizing
-
Backtest for performance under various markets and continuously improve logic
-
Add machine learning models to aid in predicting signals
These optimizations can improve win rate, profitability, and reduce erroneous trades.
Conclusion
Overall, this RSI trading strategy utilizes the RSI indicator to determine overbought and oversold market conditions and generate trade signals accordingly. Its core principle, adjustable parameters, protective stop loss, and potential optimization directions make it a viable algorithmic trading system. However, we need to be aware of the risks like false signals and constantly test and iterate the strategy to achieve best performance. With further refinements, this RSI-based approach can become a robust tool for crypto currency trading.
- 1