Simple Moving Average Crossover Strategy

Overview
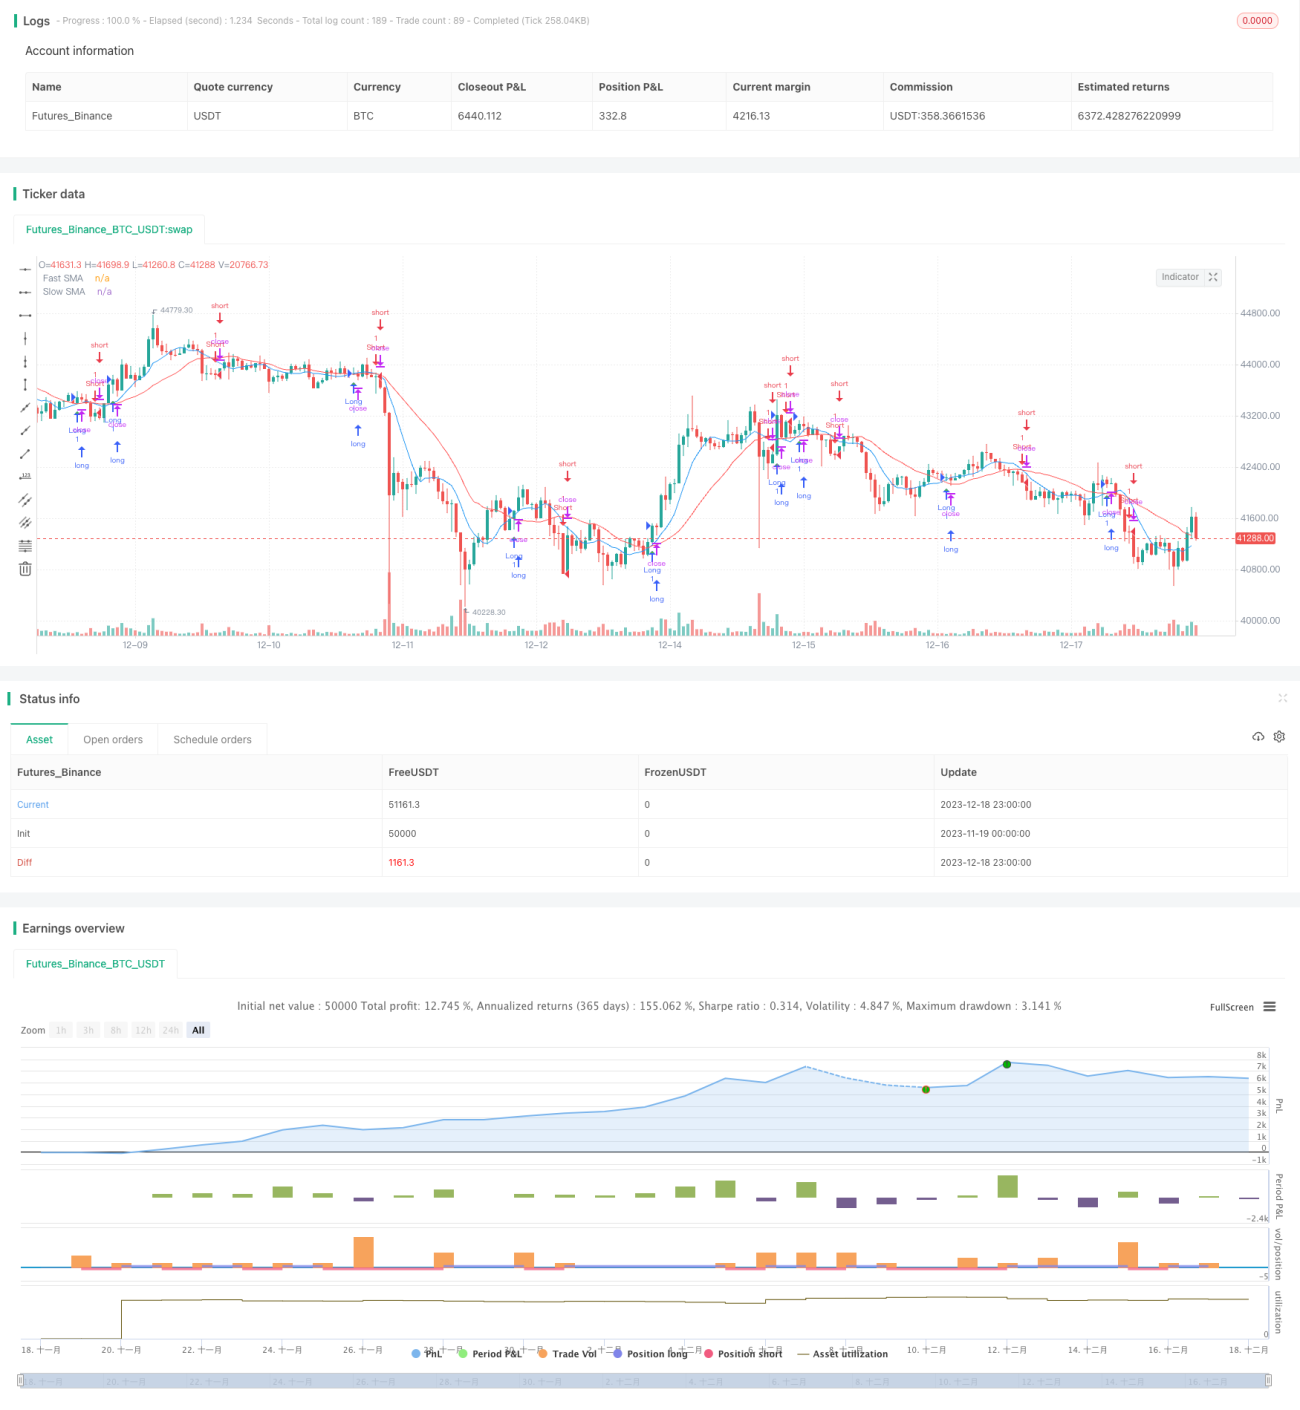
This strategy is based on the crossover between an 8-period and a 20-period simple moving average (SMA). It goes long when the faster SMA crosses above the slower SMA and goes short when the faster SMA crosses below the slower SMA. The strategy mainly utilizes the crossover of different SMAs to capture trend changes.
Strategy Logic
- Calculate the 8-period and 20-period SMA.
- Go long when the 8-period SMA crosses above the 20-period SMA.
- Go short when the 8-period SMA crosses below the 20-period SMA.
- Exit signal: Close position when a reverse crossover happens.
The strategy captures changes in short-term trends using the crossover of the fast and slow SMA. As the faster SMA reacts more sensitively to price changes, it can detect reversals in short-term trends earlier. When the faster SMA crosses above the slower SMA, it signals that the short-term trend is turning bullish and a long position should be taken. When the faster SMA crosses below the slower SMA, it signals that the market is reversing from bull to bear and a short position should be taken.
Advantages
- Simple concept, easy to understand and implement.
- Flexible parameter selection, can adapt to different market conditions.
- Clear trading signals and rules.
- Effectively captures changes in short-term trends.
The biggest advantage of this strategy is its simplicity and intuitiveness. It's easy to comprehend and implement. Meanwhile, it offers flexibility by tuning the SMA parameters to suit different market environments. It can serve as a basic strategy for further enhancements and optimizations.
Risks
- Frequent false signals or misjudgments possible.
- Hard to determine trend duration, premature entry or exit likely.
- Vulnerable to stop loss in volatile markets.
- Inappropriate parameters may lead to losses.
Since this strategy relies solely on simple SMA crossovers, its analytical capability is limited when facing complex market situations. It is unable to determine the strength or reversal points of trends, often resulting in premature entry or exit. It is also prone to being whipsawed in range-bound markets. In addition, improper parameter selection can directly impact strategy performance.
The risks can be reduced by combining with other indicators for signal confirmation and filtering. Widening the stop loss margin can also help endure volatility to some extent.
Enhancement Opportunities
- Add other indicators for signal filtering, e.g. KDJ, MACD.
- Add trend determination rules to avoid unnecessary whipsaws.
- Optimize parameters like SMA periods.
- Incorporate volatility metrics to adjust stop loss levels dynamically.
This strategy can be augmented by using other indicators in combination for extra signal validity checks and filtering. Trend determination rules can also avoid excessive reversals. Parameters and stop loss optimization could greatly improve the stability of the strategy.
Summary
The SMA crossover strategy features simple logic that is easy to grasp and implement. It captures short-term trend changes effectively through fast and slow SMA crossovers. However, it also has some flaws like producing false signals occasionally due to its weak analytical capability. By combining with other indicators, tuning parameters and stop loss properly, it can achieve better performance. The strategy lays the foundation for algorithmic trading and points to further optimization directions.
- 1