Triple EMA Trend Following Strategy

Overview
The Triple EMA Trend Following Strategy is a strategy very suitable for following market trends. It uses three EMAs of different periods as trading signals to establish long or short positions when there is sufficient trend confirmation.
The advantage of this strategy is that it can reduce false signals and ensure sufficient trend strength before entering a position. At the same time, it has an adaptive stop loss system that can trail stop based on market volatility, thus achieving better risk management.
Strategy Logic
Entry Logic
The strategy uses 7-, 14- and 21-period EMAs as entry signal indicators. The specific logic is when the price crosses above all three EMAs at the same time, go long; when the price crosses below all three EMAs at the same time, go short.
This design can reduce false signals and ensure the trend is clear enough before entering. Also, the three EMA periods are set appropriately to capture market trends in a timely manner.
Stop Loss Method
The strategy uses an adaptive stop loss system based on ATR and maximum drawdown. It calculates price volatility in real time and sets stop loss lines accordingly. Specifically, it calculates a certain multiple of ATR as the stop loss buffer zone.
During an uptrend, the stop loss line will move up with new highs, with good chasing effect. When the price falls back to the low point of the buffer zone, the stop loss line will be triggered to close positions. This can control stop loss risk according to market conditions.
Profit Taking Method
The strategy uses a fixed percentage take profit method. After opening a position, a take profit line will be set at a certain percentage above the entry price. When the price rises to the take profit line, the position will be closed to take profits.
The benefit of this fixed percentage take profit is that it allows presetting a target profit level that will satisfy exiting once reached. It also avoids the risk of prices falling back again. The take profit percentage can be adjusted as needed.
Advantage Analysis
- Can reduce false signals and ensure a relatively strong price trend after opening positions
- Use overlay of EMA periods to quickly capture market trends
- Adaptive stop loss system can control risk based on volatility
- Fixed take profit percentage satisfies profit target before exiting
- Stop loss method based on ATR and maximum drawdown can optimize based on market conditions
- Easy to adjust strategy style by changing parameters
Risk Analysis
- In ranging markets, EMAs may produce frequent crosses, easily being trapped
- Fixed take profit cannot adjust based on market conditions, may miss greater profits or increase losses
- After stop tracking stop loss, unable to track new highs again, price drops may increase losses
- In one-sided explosive trends, fixed take profit percentage may be too conservative, fail to obtain enough profits
Can avoid blindly opening positions in volatile markets by combining with trend judgment indicators; can also use moving take profit or profit ratio methods to make take profit methods more flexible. In general, manual judgment is still needed to cooperate with strategy application.
Optimization Directions
The strategy can also be optimized in the following aspects:
-
Use more indicators to determine entry timing, such as MACD, KD etc, avoid being trapped in volatile markets.
-
Try moving take profit, or profit ratio take profit methods, to make take profit methods more flexible.
-
Add downward trailing mechanism to stop loss method, allowing tracking lower points again when price drops again, thereby controlling risk.
-
Adjust EMA period parameters based on characteristics of different products, optimizing trend judgment.
-
Add position sizing module, can adjust per trade size based on usage ratio of funds.
Conclusion
The Triple EMA Trend Following Strategy is a very practical trend following strategy. It has strong trend judgment capabilities, while also having adaptive take profit and stop loss mechanisms that can automatically manage orders. From the optimization perspective, the take profit and stop loss systems can be further improved to adjust based on real-time market conditions. But overall, this strategy is an easy to implement and controllable risk choice.
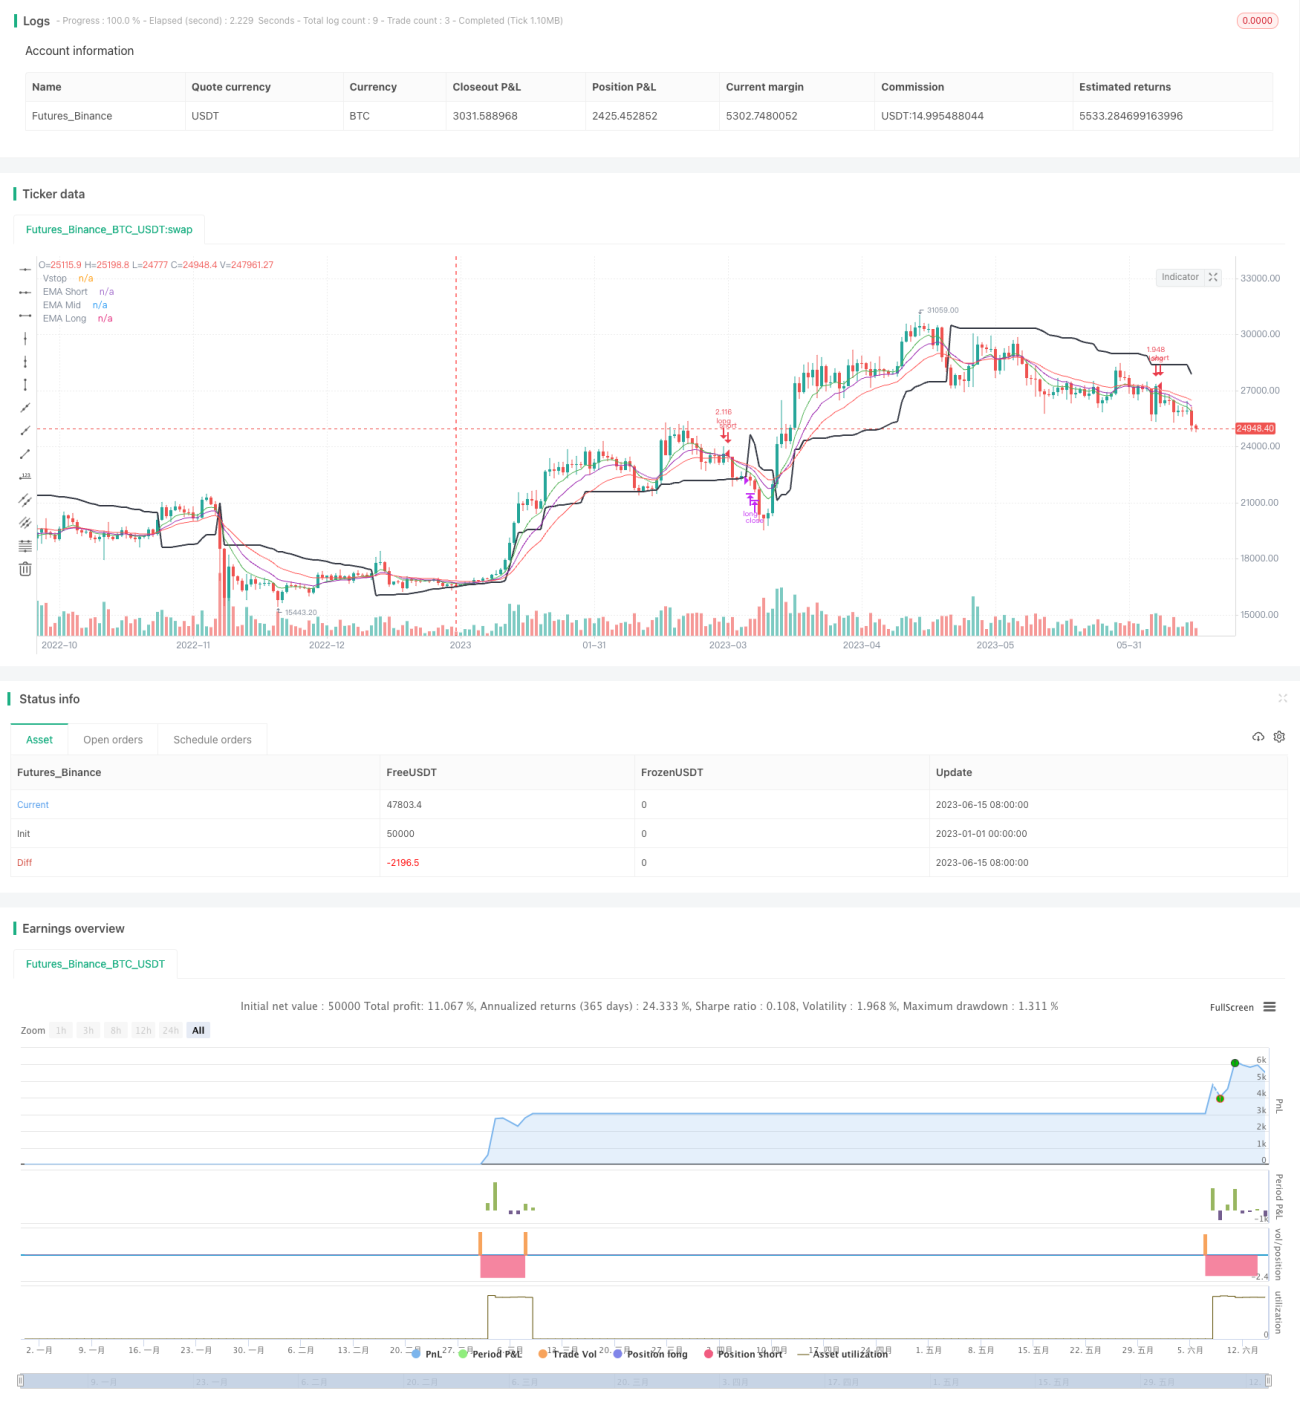
/*backtest
start: 2023-01-01 00:00:00
end: 2023-06-16 00:00:00
period: 1d
basePeriod: 1h
exchanges: [{"eid":"Futures_Binance","currency":"BTC_USDT"}]
*/

//@version=4
strategy(shorttitle='Three EMAs Trend-following Strategy',title='Three EMAs Trend-following Strategy (by Coinrule)', overlay=true, initial_capital = 1000, process_orders_on_close=true, default_qty_type = strategy.percent_of_equity, default_qty_value = 100, commission_type=strategy.commission.percent, commission_value=0.1)
- 1