The Relative Volume Indicator Strategy

Strategy Overview
This is a quantitative trading strategy based on the Relative Strength Index (RSI) and the Relative Volume indicator. The strategy aims to capture excess returns by trading the fastest stage of a strong trend.
Strategy Logic
The strategy incorporates two indicators: Relative Strength Index (RSI) and Relative Volume (RVOL). RSI judges the overbought/oversold levels. RSI below 30 suggests oversold and RSI above 70 suggests overbought. RVOL captures surges in volume compared to recent average. When RVOL is above a threshold, it indicates strong buying/selling pressure.
The strategy logic is: go long when RSI shows overbought (above threshold) AND RVOL shoots up; go short when RSI shows oversold (below threshold) AND RVOL shoots up. Exit signals happen when RSI returns to normal level (long exit: RSI below 69; short exit: RSI above 31).
Advantage Analysis
The biggest edge of this strategy is to locate the most aggressive part of a trend by combining overbought/oversold signal from RSI and the high relative volume signal. Using the combo signal of RSI and RVOL can avoid lots of false breakouts and improve profitability.
Compared to using RSI alone, this strategy incorporates volume information to avoid entering the market with insufficient liquidity. Compared to using breakout alone, this strategy prevents trading against the major trend in OB/OS regions.
Risk Analysis
The biggest risk of this strategy is the possibility of RSI giving false signals. When market is ranging, RSI may frequently cross in/out of OB/OS zones and generate fake signals. Also, this strategy is sensitive to volume changes. Low liquidity instruments can discount the profitability.
To mitigate the risks, parameters of RSI can be adjusted, like increasing averaging period, or lifting the threshold for RVOL. Combining other indicators helps improve robustness too.
Optimization Directions
The potential optimizations include:
-
Add liquidity metrics to avoid illiquid instruments;
-
Add volatility metrics to trade only when volatility expansions;
-
Build mechanisms to avoid false breakouts, e.g. monitoring volume;
-
Make stop loss more strict, to limit drawdowns;
-
Parameter tuning based on backtests to find optimum settings.
Conclusion
The Relative Volume strategy manages to locate points of surging volume within OB/OS zones by incorporating RSI and relative volume, making it an effective trend catching strategy. With clear logic and robust optimizations, it can be a valuable addition to the quantitative trading system.
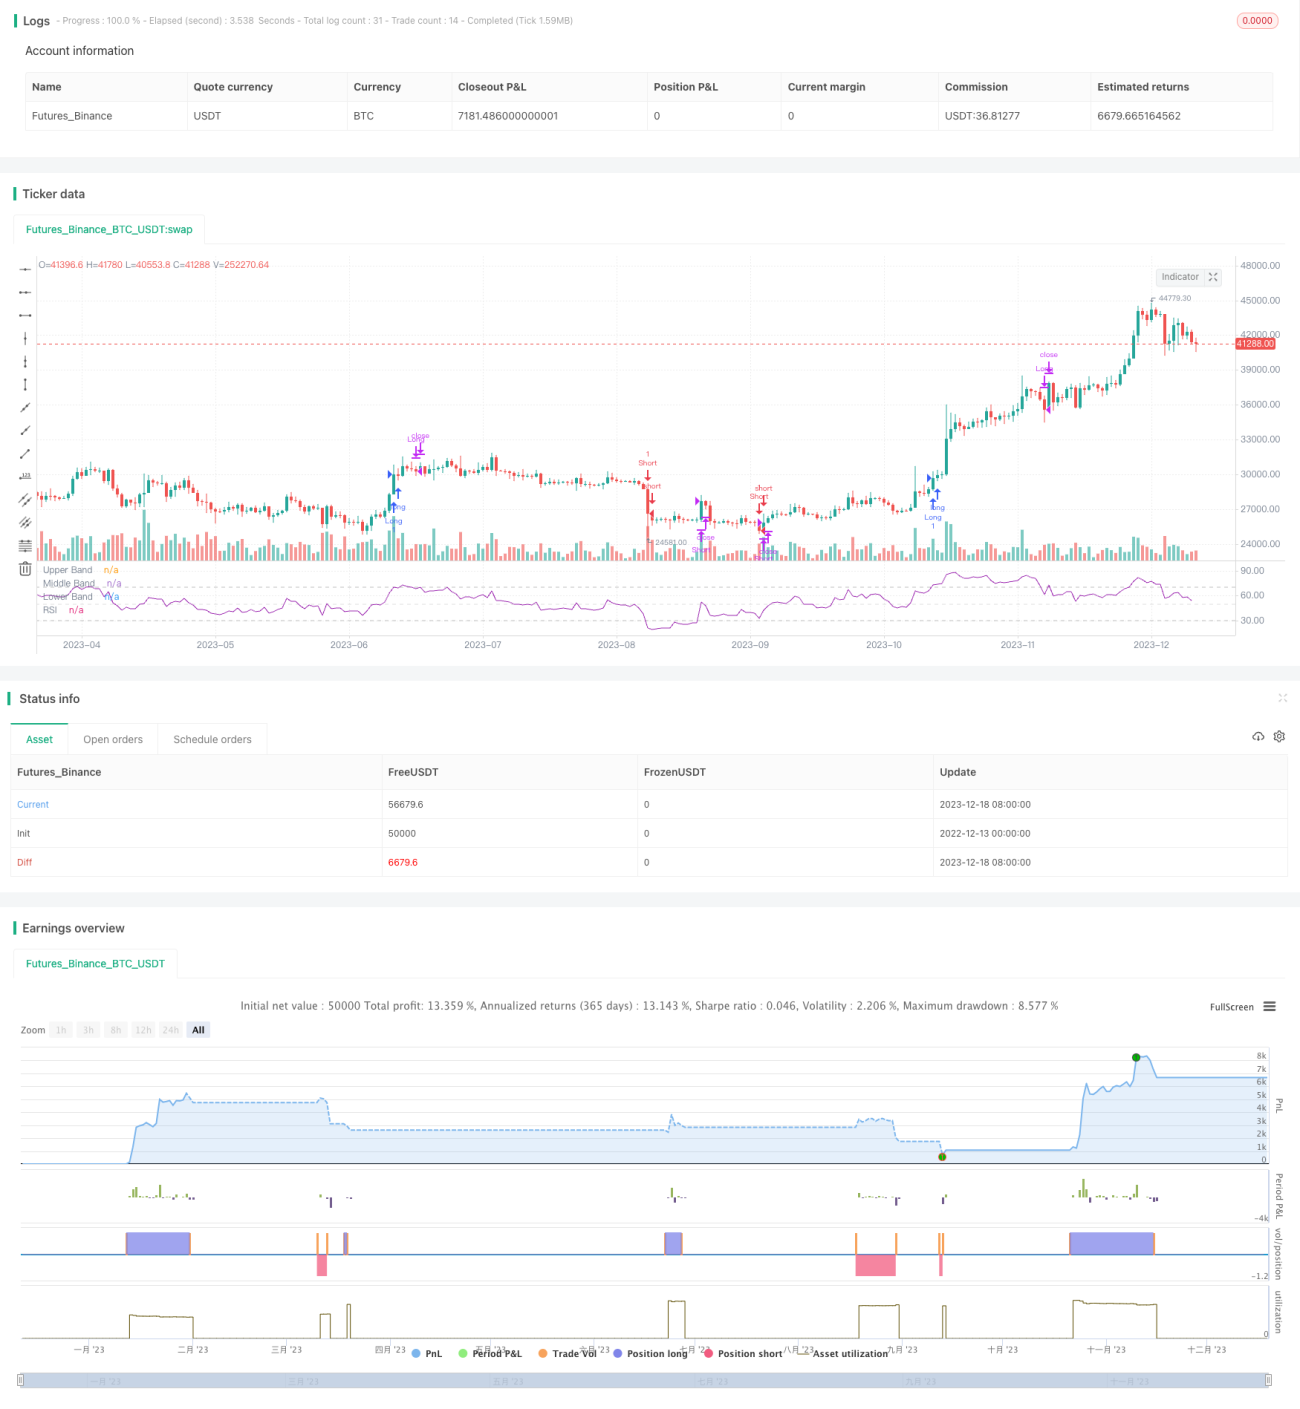
/*backtest
start: 2022-12-13 00:00:00
end: 2023-12-19 00:00:00
period: 1d
basePeriod: 1h
exchanges: [{"eid":"Futures_Binance","currency":"BTC_USDT"}]
*/

// This source code is subject to the terms of the Mozilla Public License 2.0 at https://mozilla.org/MPL/2.0/
// © gary_trades
//This script is a basic concept to catch breakout moves utilising a spike in relative volume when the RSI is high (for longs) or when the RSI is low (for shorts).
//Drawdown is typically low as it exits out of the trade once the RSI returns back to "normal levels".- 1