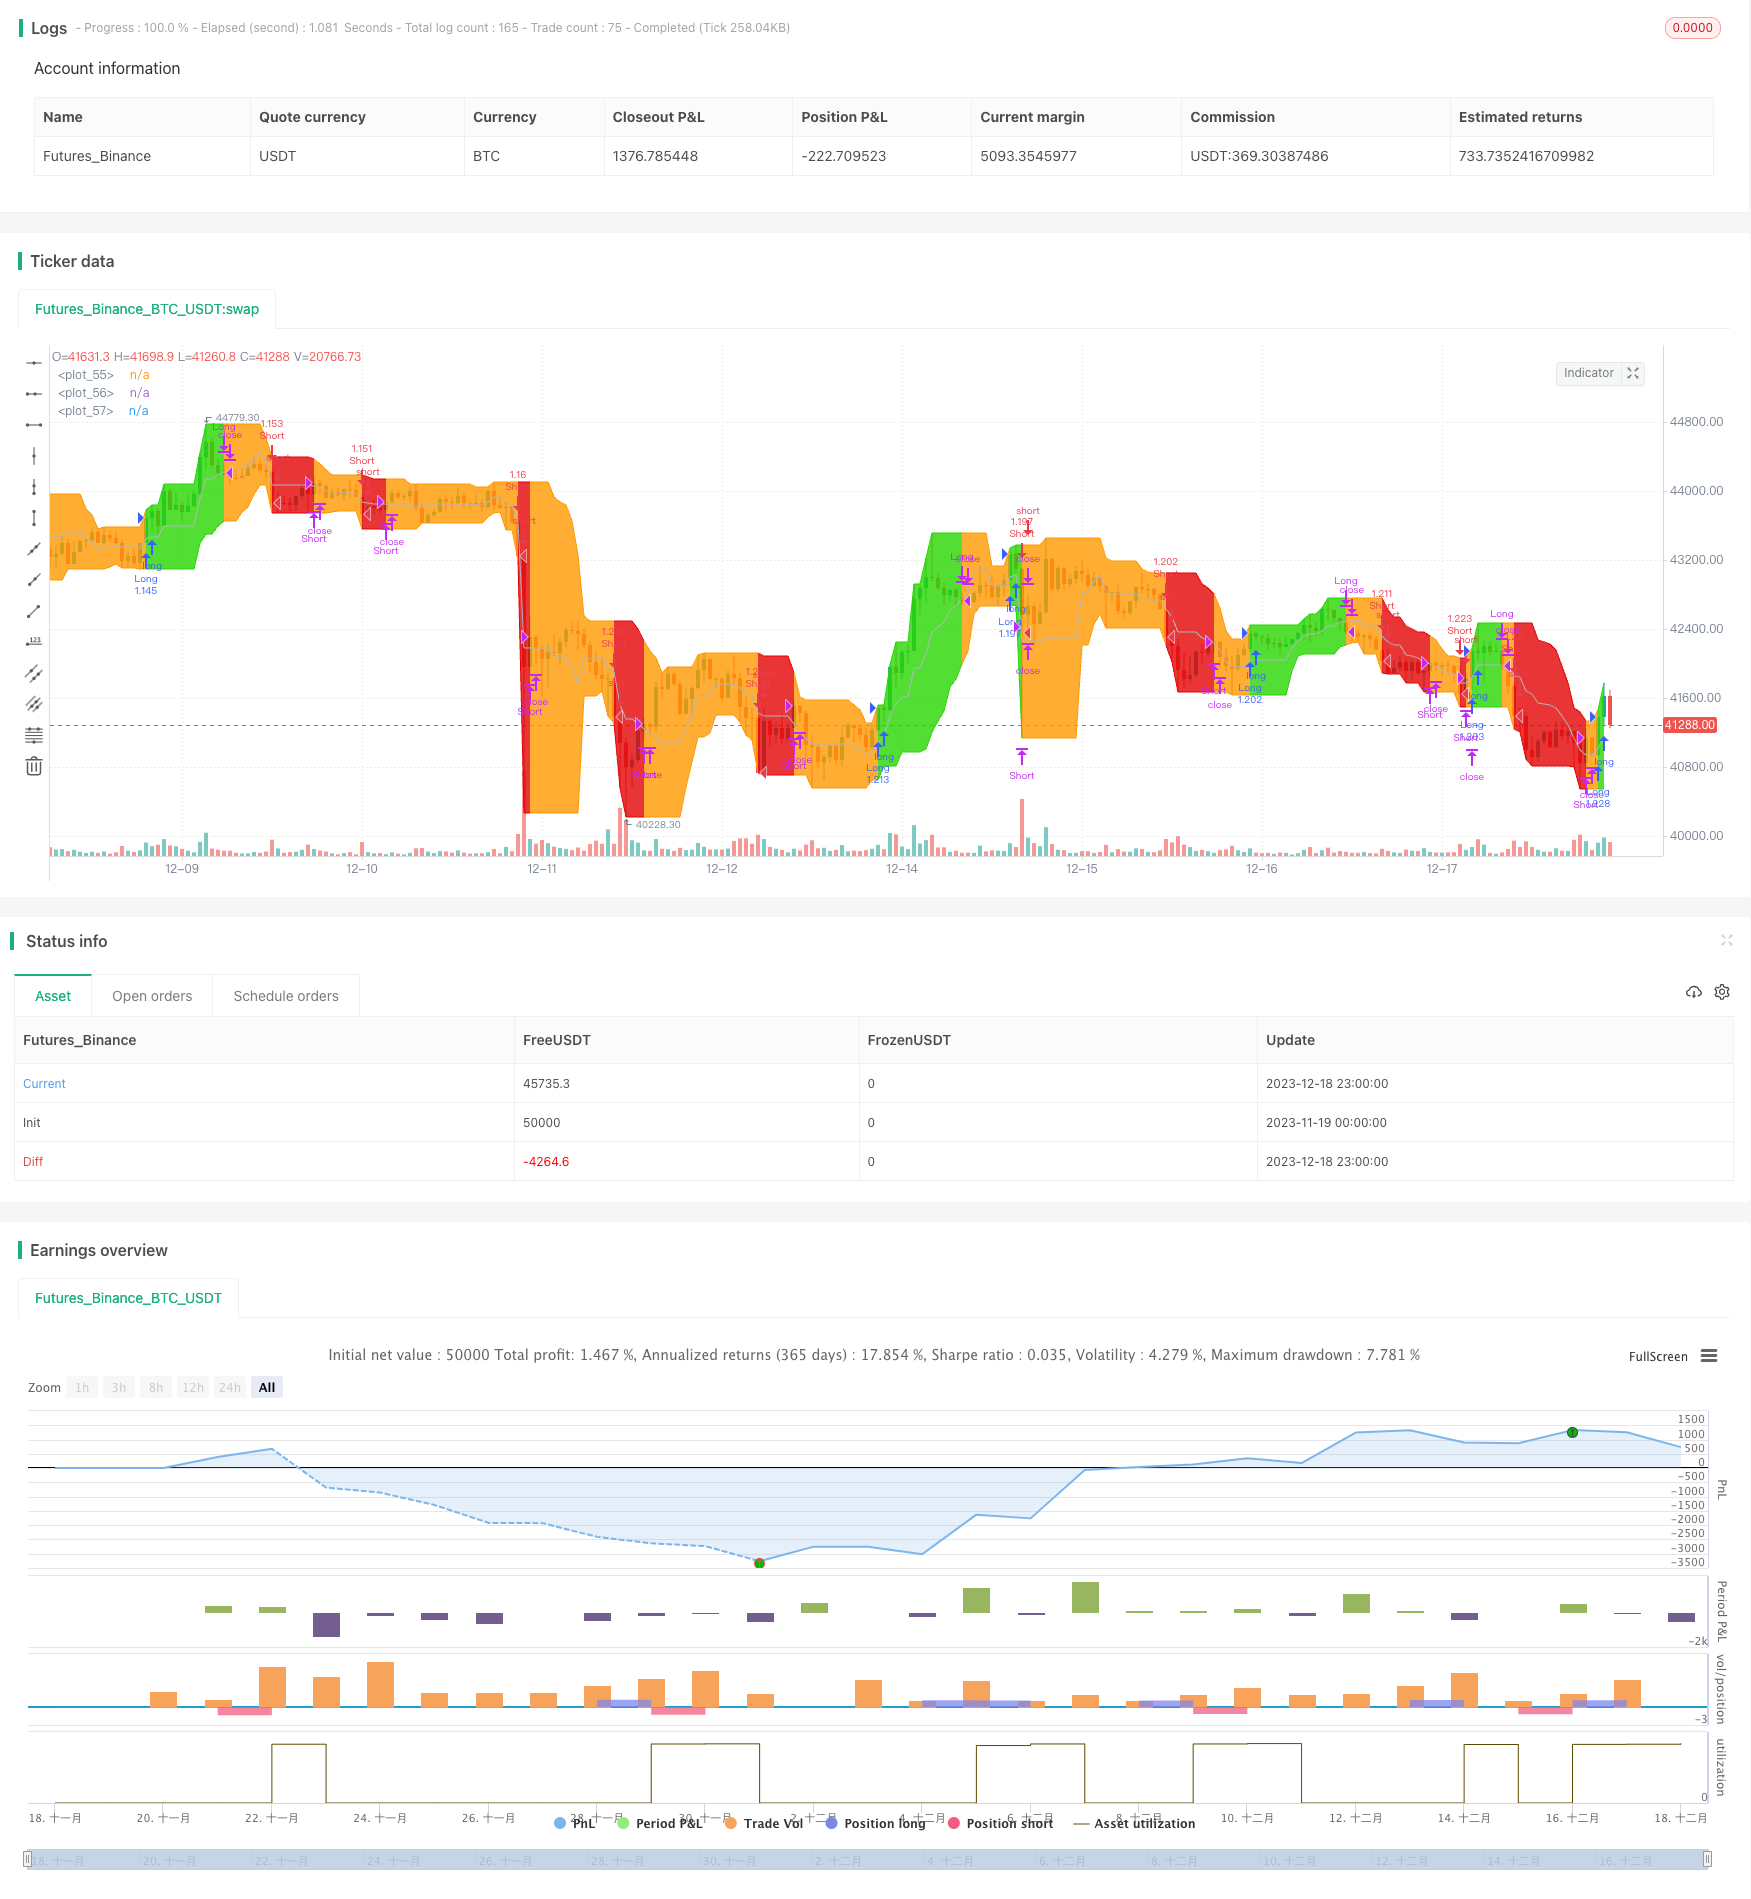
概述
动量捕捉通道策略是一个基于Donchian通道的变体。它由最高价带,最低价带和作为最高价带和最低价带平均值的基线组成。这个策略在趋势性品种的周线和日线时间框架上非常有用。这就是QuantCT应用中使用的实现。
您可以将操作模式设置为多空或仅多头。
您还可以设置固定止损或忽略它,以便该策略仅根据入市和退出信号进行操作。
策略原理
这个策略的核心逻辑是基于Donchian通道指标。Donchian通道由20天内的最高价,最低价和收盘价的平均值组成。根据价格突破通道上下轨来判断趋势方向和可能的反转。
本策略是Donchian通道的变体。它由最高价带,最低价带和作为最高价带和最低价带平均值的基线组成。具体逻辑如下:
- 计算一定周期内的最高价和最低价作为通道上下轨
- 计算上下轨的平均值作为基线
- 当价格突破上轨时,做多
- 当价格跌破基线时,平多仓
- 当价格跌破下轨时,做空(若允许空头)
- 当价格重新夺回基线时,平空仓
该策略的优势在于能够有效捕捉价格的趋势动量。通过等待价格突破上下轨来判断真正的趋势启动,可以避免被谈头造成不必要的损失。
优势分析
- 捕捉价格趋势动量,实现盈利增长
- 避免被假突破套牢,减少不必要损失
- 可以灵活调整参数,适用于不同品种
- 可选择仅做多或全仓操作,满足不同需求
- 集成止损机制,可以有效控制单笔损失
风险分析
- 捕捉趋势的同时,也会放大突破失败的损失
- 止损设置过于宽松,单笔损失可能扩大
- 参数设置不当可能导致频繁交易,增加交易成本
- 突破信号判断存在一定滞后,可能错过最优入场点
解决方法:
- 选择止损比例要慎重,既要控制损失,也要给趋势足够的空间
- 增大参数周期数值,降低交易频率
- 结合其他指标判断趋势信号可靠性,选择更优入场时机
优化方向
- 整合其它指标判断入场时机
- 动态调整止损位置
- 根据品种特性优化参数设置
- 结合机器学习判断突破的成功率
- 增加仓位管理逻辑
总结
动量捕捉通道策略通过捕捉价格趋势提供了可观的盈利机会。同时,它也具有一定的风险,需要适当调整参数进行风险控制。通过不断优化入场时机选择和止损逻辑,该策略可以成为一个非常出色的趋势跟随系统。它简单的交易规则和清晰的信号判断,使其易于理解和实现,非常适合新手交易者。
策略源码
/*backtest
start: 2023-11-19 00:00:00
end: 2023-12-19 00:00:00
period: 1h
basePeriod: 15m
exchanges: [{"eid":"Futures_Binance","currency":"BTC_USDT"}]
*/

// This source code is subject to the terms of the Mozilla Public License 2.0 at https://mozilla.org/MPL/2.0/
// © QuantCT

//@version=4
strategy("Donchian Channel Strategy Idea",
         shorttitle="Donchian",
         overlay=true,
         pyramiding=0,
         default_qty_type=strategy.percent_of_equity,
         default_qty_value=100,
         initial_capital=1000,
         commission_type=strategy.commission.percent,
         commission_value=0.075)

// ____ Inputs

high_period = input(title="High Period", defval=10)
low_period = input(title="Low Period", defval=10)
long_only = input(title="Long Only", defval=false)
slp = input(title="Stop-loss (%)", minval=1.0, maxval=25.0, defval=5.0)
use_sl = input(title="Use Stop-Loss", defval=false)

// ____ Logic

highest_high = highest(high, high_period)
lowest_low = lowest(low, low_period)
base_line = (highest_high + lowest_low) / 2

enter_long = (close > highest_high[1])
exit_long = (close < base_line)
enter_short = (close < lowest_low[1])
exit_short = (close > base_line)

strategy.entry("Long", strategy.long, when=enter_long)
strategy.close("Long", when=exit_long)
if (not long_only)
    strategy.entry("Short", strategy.short, when=enter_short)
    strategy.close("Short", when=exit_short)

// ____ SL

sl_long = strategy.position_avg_price * (1- (slp/100))
sl_short = strategy.position_avg_price * (1 + (slp/100))
if (use_sl)
    strategy.exit(id="SL", from_entry="Long", stop=sl_long)
    strategy.exit(id="SL", from_entry="Short", stop=sl_short)

// ____ Plots

colors =
 strategy.position_size > 0 ? #27D600 :
 strategy.position_size < 0 ? #E30202 :
 color.orange

highest_high_plot = plot(highest_high, color=colors)
lowest_low_plot = plot(lowest_low, color=colors)
plot(base_line, color=color.silver)
fill(highest_high_plot, lowest_low_plot, color=colors, transp=90)