Momentum Reversal Trading Strategy

Overview
This is a reversal trading strategy based on the Momentum indicator. It uses the Ease of Movement (EOM) indicator to determine market trends and goes long or short when the indicator exceeds preset thresholds. It also provides reverse trading function that allows choosing between regular or reverse trading.
Strategy Logic
The Ease of Movement (EOM) indicator gauges the magnitude of price and volume changes. It returns both positive and negative values. A positive value means the price has gone up and a negative value means the price has gone down. The larger the absolute value, the bigger the price change and/or the smaller the trading volume.
The logic behind this strategy is:
- Calculate current bar's EOM value
- Check if the EOM value exceeds long or short threshold
- If above long threshold (default 4000), go long
- If below short threshold (default -4000), go short
- Provide reverse trading function
- By default, long = bullish, short = bearish
- When reverse is enabled, long = bearish, short = bullish
Advantage Analysis
The main advantages of this strategy:
- Use EOM indicator to determine actual market trend based on price and volume changes
- Customizable threshold for long/short
- Provide reverse trading mode
- Intuitive long/short signal from bar color
Risk Analysis
The main risks of this strategy:
- EOM could have false breakout
- Improper threshold may lead to over/under trading
- Need sufficient risk tolerance for reverse trading
Solutions:
- Use other indicators to avoid false signal
- Optimize parameters and adjust threshold
- Evaluate your own risk tolerance level
Optimization
This strategy can be optimized in the following aspects:
- Add moving average to avoid false breakout
- Add stop loss
- Optimize long/short threshold parameters
- Add more entry conditions to control trading frequency
- Add risk management rules for reverse trading
By making the above optimizations, the strategy can become more robust, lower risks, and improve real trading performance.
Conclusion
In conclusion, this strategy utilizes the Ease of Movement indicator to determine actual market trends, and profits from long/short trading. It is easy to use and considers both price change and volume change factors. When apply it in real trading, it is recommended to incorporate other technical indicators and optimize parameters properly for better performance.
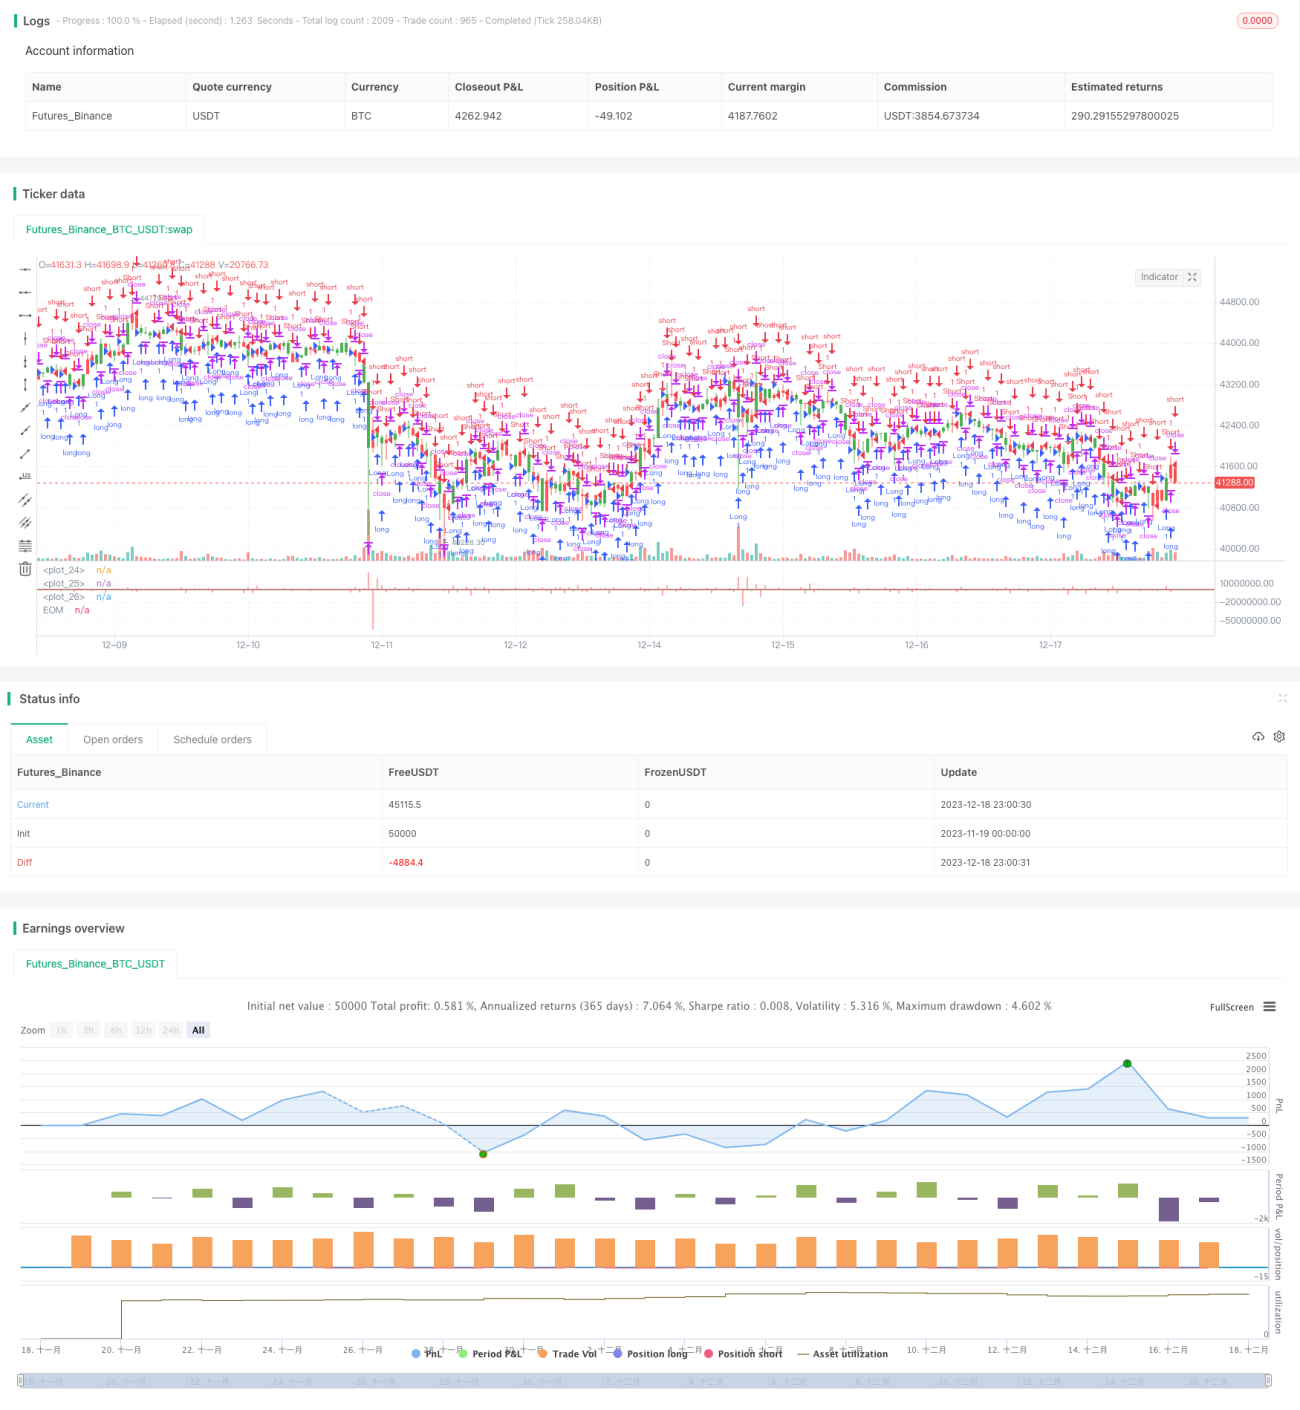
/*backtest
start: 2023-11-19 00:00:00
end: 2023-12-19 00:00:00
period: 1h
basePeriod: 15m
exchanges: [{"eid":"Futures_Binance","currency":"BTC_USDT"}]
*/

//@version=2
////////////////////////////////////////////////////////////
//  Copyright by HPotter v1.0 19/06/2018
// This indicator gauges the magnitude of price and volume movement. - 1