The VWAP breakout tracking strategy

Overview
The VWAP breakout tracking strategy is a trend-following strategy that uses the VWAP indicator to identify trend direction. It detects price breakouts across VWAP based on the closing prices of the recent 5 bars. When 3 consecutive bars breakout VWAP in the same direction, the highest/lowest price of the 3rd bar is recorded. A trading signal is then generated when price breaks through that recorded highest/lowest price level.
The key advantage of this strategy is its quick response to catch breakout opportunities for ultra short-term momentum trading. However, there is also the risk of accumulating too large of a position. This can be optimized by adjusting the position sizing parameters.
Strategy Logic
Indicator Calculation
The core indicator used in this strategy is VWAP. VWAP stands for Volume Weighted Average Price, which is a volume-weighted average price line. It reflects the market consensus price level.
The strategy calculates the closing prices of the most recent 5 bars and the VWAP indicator in real-time. It also defines a series of logical variables to check for specific types of consecutive VWAP breakouts.
Trading Signals
The trading signals are generated based on the new highest/lowest prices created by price breakouts. The logic is:
- Check if the closing prices of the most recent 3 bars breakout VWAP in the same direction consecutively (e.g. prices rising or falling)
- If yes, record the highest/lowest price of the 3rd bar in that direction
- Enter trade when price breaks through the recorded highest/lowest price
So the core idea is to identify the direction of price breakouts, and trade the new highest/lowest prices resulted from the breakouts.
Position Sizing
The default position sizing is set at 100% of equity. This represents a full position on every trade. Considering the short-term nature of this strategy, the position size could be reduced to control risk.
The exit rule is a VWAP crossunder/crossover. VWAP serves as the trailing stop loss to avoid runaway losses.
Advantage Analysis
The biggest advantage of the VWAP breakout tracking strategy is its quick response to catch short-term price momentum and trend-following opportunities. The key advantages are:
- Quick reaction to price breakouts and momentum movements
- VWAP indicator offers reasonably reliable directional bias
- Default full position sizing allows maximized profits
- VWAP acts as risk management to contain losses
This strategy is especially suitable for high-frequency short-term trading, allowing quick locking-in of profits. It performs the best with volatile instruments like crude oil and gold.
Risk Analysis
Although this strategy has efficient tracking capability, there are still risks to consider:
- Accumulating excessive position from frequent tracking
- Limited effectiveness of VWAP to fully prevent losses
- High trading costs from frequent exits/entries
- Full position sizing by default implies high risk and drawdowns
The following optimizations could help mitigate those risks:
- Reduce position sizing ratio to limit impact per loss
- Add filter conditions with more indicators to improve signal accuracy
- Relax stop loss distance to prevent over-stopping out
- Add profit-taking mechanisms like PROTECT to lock in gains
Optimization Directions
As an ultra short-term tracking strategy, further optimizations could be done from these areas:
-
Multi-indicator integration: Combine other volatility and momentum indicators to set stricter filter rules and improve accuracy
-
Dynamic position sizing: Adjust position size dynamically based on changing market conditions. Reduce when volatility surges and increase during strong trends.
-
Adaptive stops: Upgrade fixed VWAP stops to adaptive trailing stop mechanism based on ATR and other price action signals.
-
Risk management: Establish more risk metrics constraints like maximum holding periods, profit/loss limits per day, drawdown limit etc. to control risks.
-
Machine learning: Collect historical trade data and adopt machine learning models to find optimal strategy parameters for higher stability.
Conclusion
Overall, the VWAP breakout tracking strategy is a very practical high-frequency trading system. It responds swiftly to short-term breakout opportunities and tracks prices using full position for quick scalping. The built-in VWAP trailing stop also helps restrict risks.
With further optimizations like multi-indicator filtering, dynamic position sizing, adaptive stops and machine learning, this strategy can achieve even better efficiency and stability. It has great potential for high-frequency traders. The ongoing enhancement of this strategy is strongly recommended due to its practical applicability.
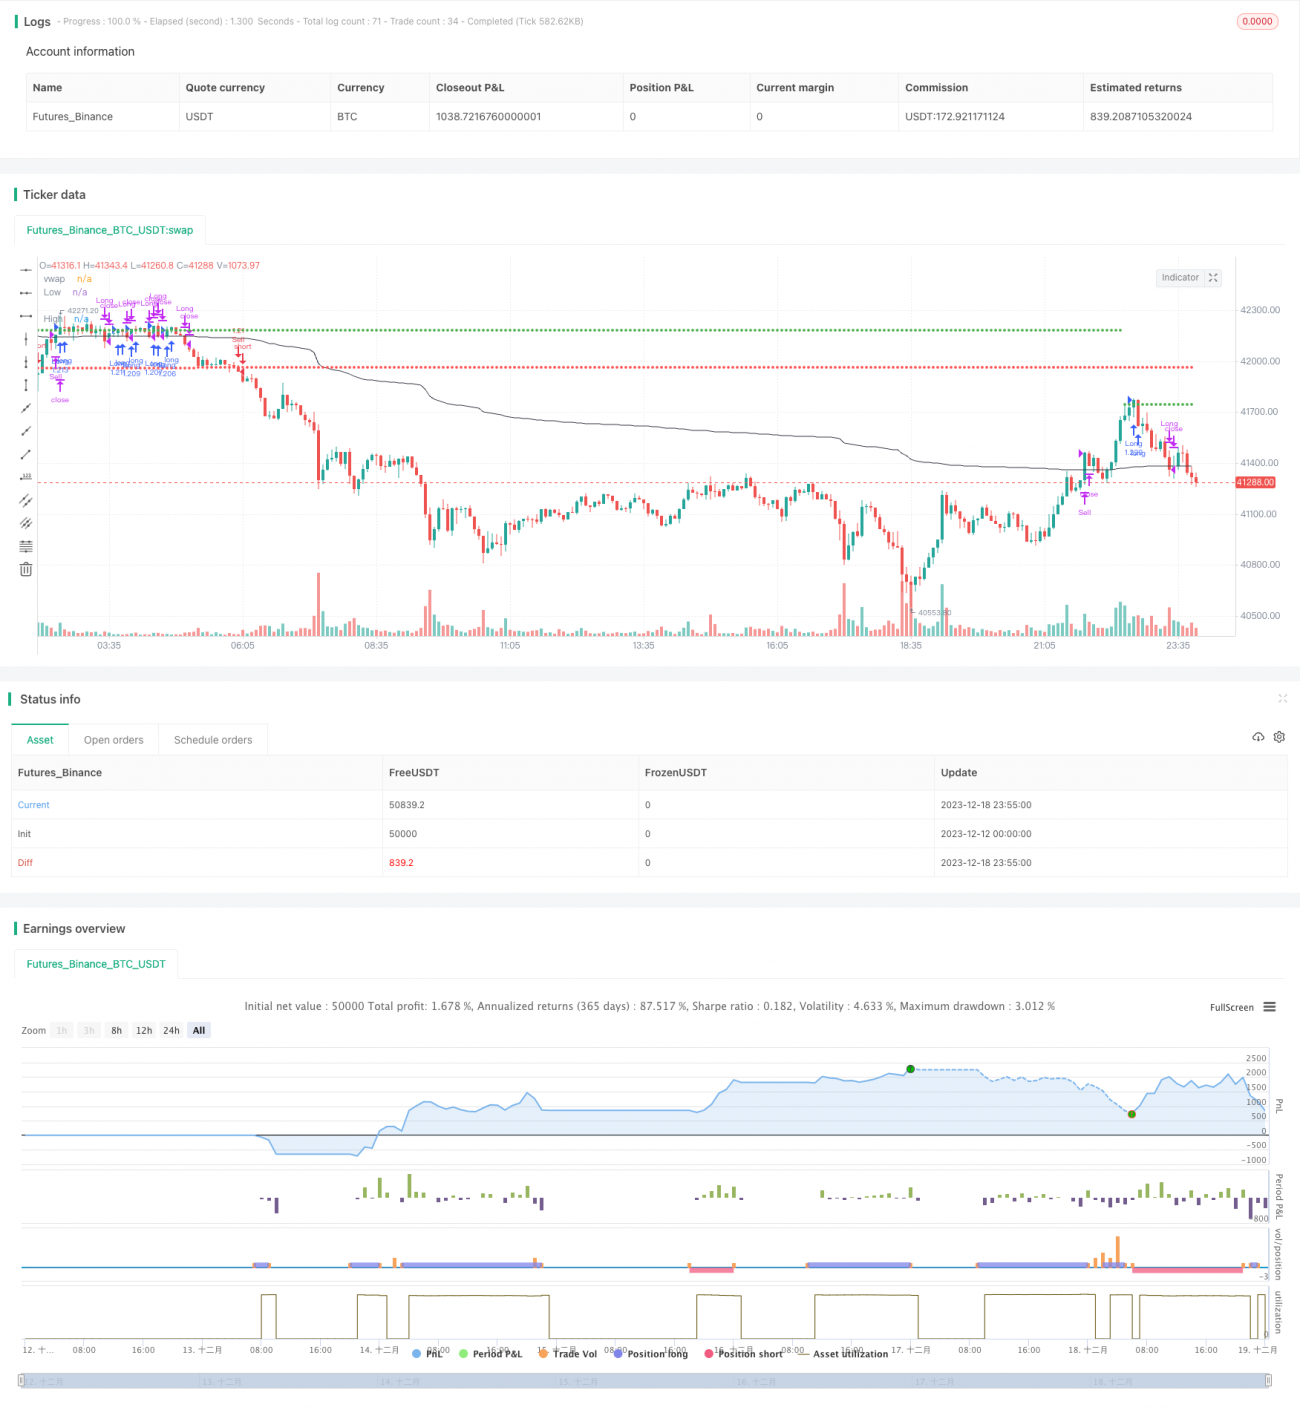
/*backtest
start: 2023-12-12 00:00:00
end: 2023-12-19 00:00:00
period: 5m
basePeriod: 1m
exchanges: [{"eid":"Futures_Binance","currency":"BTC_USDT"}]
*/


//@version=5
strategy(title="VWAP Push", initial_capital = 100000, default_qty_type = strategy.percent_of_equity, default_qty_value = 100, pyramiding = 0, currency = 'USD', overlay=true)
- 1