Dual EMA Golden Cross Breakthrough Strategy

1
Follow
1779
Followers
Overview
This strategy is a trend following strategy based on golden cross and death cross operations of the 5-minute and 34-minute exponential moving averages (EMA) lines. It goes long when the fast EMA crosses over the slow EMA from below, and goes short when the fast EMA crosses below the slow EMA from above. It also sets stop profit and stop loss to control risks.
Strategy Principle
- The fast EMA5 and slow EMA34 form trading signals. EMA5 reflects recent Price changes and EMA34 reflects mid-term Price changes.
- When EMA5 crosses over EMA34, it's a golden cross, indicating the short-term trend is better than the mid-term trend, so hold long position.
- When EMA5 crosses below EMA34, it's a death cross, indicating the short-term trend is worse than the mid-term trend, so hold short position.
- Set stop profit and stop loss to lock in profits and control risks.
Advantage Analysis
- Using dual EMA filters false breakouts and avoids being trapped.
- Following mid-term trends enhances profit opportunities.
- Setting stop profit and stop loss effectively controls risks.
Risk Analysis
- Dual EMA has lagging effect and may miss short-term trading opportunities.
- Stop loss set too wide enlarges loss risks.
- Stop profit set too tight loses opportunities to maximize profits.
Optimization Directions
- Optimize EMA parameters to find the best parameter combination.
- Optimize stop profit and stop loss points to lock in greater profits.
- Add other indicators like MACD, KDJ to filter signals and improve accuracy.
Summary
This strategy generates trading signals from golden crosses and death crosses of the dual EMA lines, and sets stop profit and stop loss to control risks. It is a simple and effective mid-term trend following strategy. Further enhancing stable profitability can be achieved by optimizing stop profit/loss parameters and introducing other indicators to filter signals.
Source
Pine
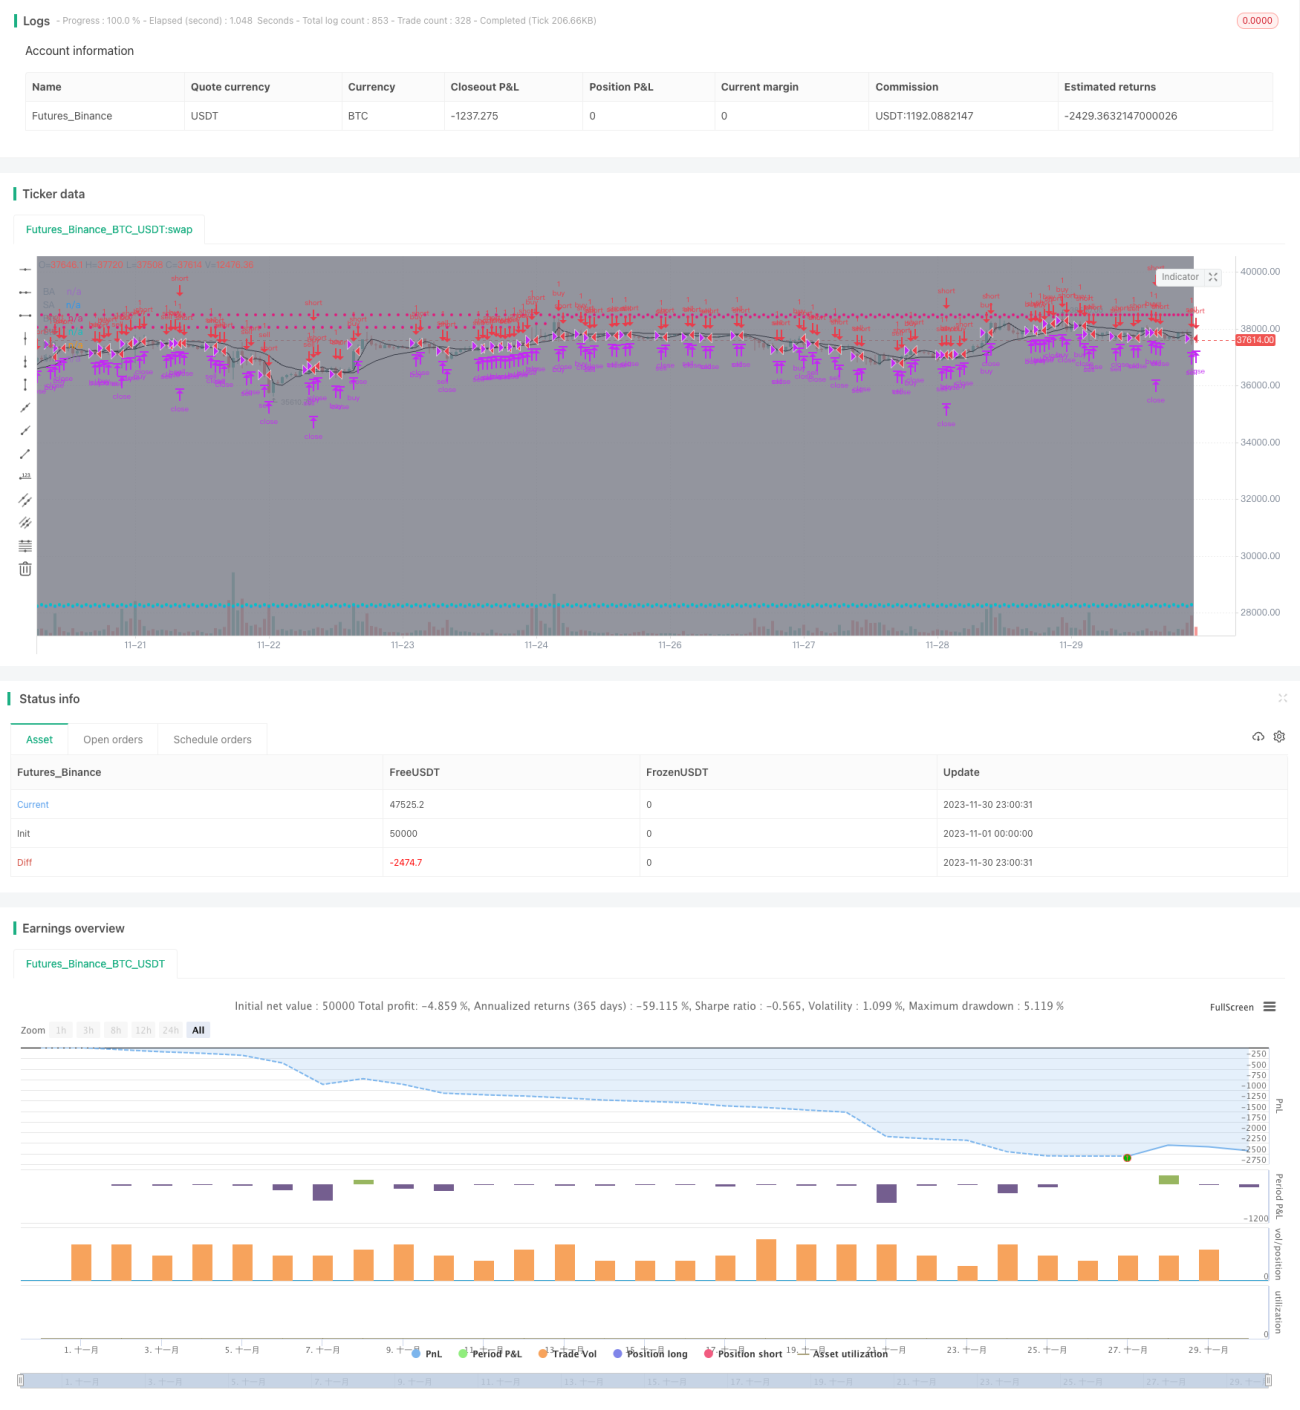
/*backtest
start: 2023-11-01 00:00:00
end: 2023-11-30 23:59:59
period: 1h
basePeriod: 15m
exchanges: [{"eid":"Futures_Binance","currency":"BTC_USDT"}]
*/

//@version=2
strategy(title='[STRATEGY][RS]MicuRobert EMA cross V2', shorttitle='S', overlay=true, pyramiding=0, initial_capital=100000)
USE_TRADESESSION = input(title='Use Trading Session?', type=bool, defval=true)
USE_TRAILINGSTOP = input(title='Use Trailing Stop?', type=bool, defval=true)Strategy parameters
Related strategies
Comment
All comments (0)
No data
- 1