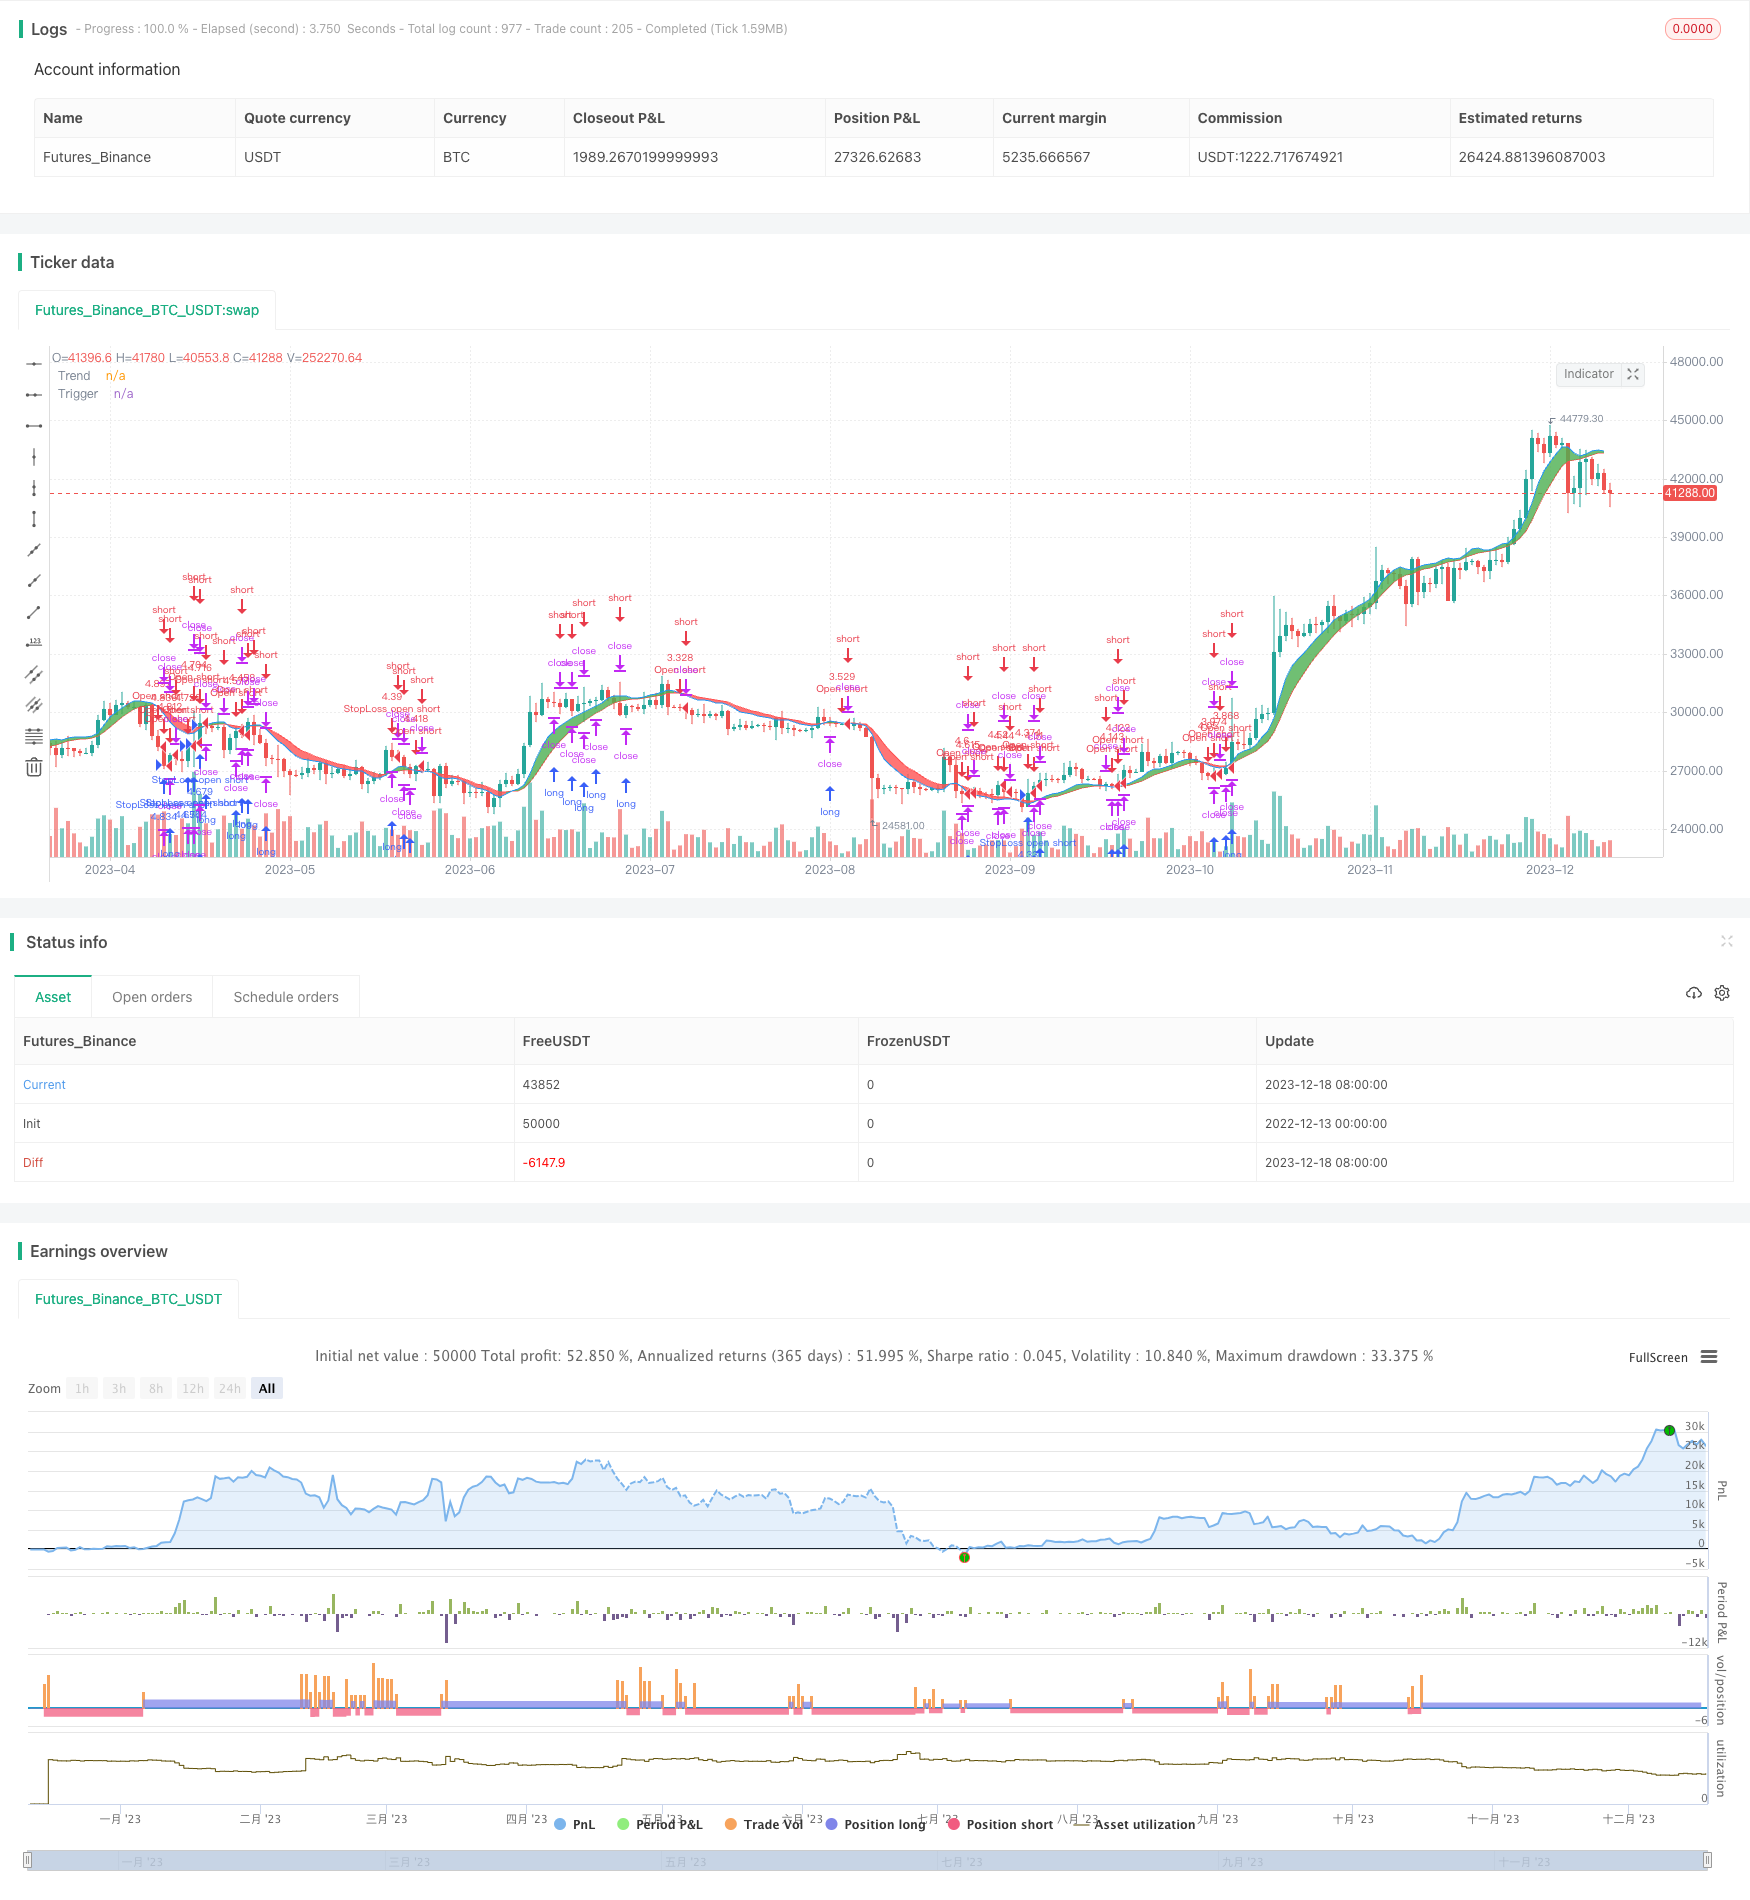
概述
埃尔斯即时趋势线策略是John Ehlers在他的书《股票和期货的控制分析》中提出的。该策略利用技术指标来识别股票或期货的即时趋势,并在趋势反转时打开仓位。
策略原理
该策略的核心是计算即时趋势线(IT)。IT线的计算公式如下:
it := (a-((a*a)/4.0))*src+0.5*a*a*src[1]-(a-0.75*a*a)*src[2]+2*(1-a )*it[1]-(1-a )*(1-a )*it[2]
其中src代表价格,a是一个平滑因子,默认值为0.07。该公式是一个二阶滤波器,能够平滑价格并生成趋势。
另一个关键指标是滞后线(lag),计算公式为:
lag = 2.0 * it - nz(it[2])
该线滞后于IT线一个周期。当价格上穿滞后线时,代表趋势反转,做多;当价格下穿滞后线时,代表趋势反转,做空。
此外,策略还设定了止损单来控制风险。
优势分析
该策略具有以下优势:
- 使用IT线识别趋势,能够有效过滤市场噪音,提高信号质量
- 应用二阶滤波器,参数优化空间大,可调性高
- 结合滞后线生成交易信号,避免在趋势中反复开平仓
- 设定止损单控制风险,可以预设止损比例
- 代码结构清晰,易于理解和修改
风险分析
该策略也存在一些风险:
- IT线和滞后线参数设置不当可能导致产生错误信号
- 止损点设置不当可能过早止损或止损幅度过大
- 交易频率可能较高,交易成本影响盈利
- 集中持仓时间过长可能 magnification 效应影响收益率
这些风险可以通过以下方法减轻:
- 应用机器学习算法优化参数
- 设置自适应止损点位
- 适当调整开仓数量,降低交易频率
- 设定持仓周期止损
优化方向
该策略可以从以下几个方向进行优化:
- 测试不同滤波器参数对结果的影响,寻找最优参数
- 尝试结合其他指标筛选交易信号,提高信号质量
- 优化开仓逻辑,在趋势加速阶段加大仓位
- 设置自适应止损策略,根据市场波动程度调整止损点
- 进行时间序列分析,判断交易时间和周期对结果的影响
结论
总的来说,埃勒斯瞬时趋势线策略利用技术指标来识别股票/期货的实时趋势,并在趋势反转时开仓。它具有有效的噪声过滤、高参数可调性、清晰的信号生成逻辑和内置风险控制等优点。通过进一步优化参数选择、信号过滤、头寸规模和止损调整,这个策略可以取得更好的表现。清晰的代码结构也使其易于理解和修改。总之,这是一个值得测试和改进的高效跟踪系统。
策略源码
/*backtest
start: 2022-12-13 00:00:00
end: 2023-12-19 00:00:00
period: 1d
basePeriod: 1h
exchanges: [{"eid":"Futures_Binance","currency":"BTC_USDT"}]
*/

//@version=3
strategy("Ehlers Instantaneous Trendline Strategy", shorttitle = "Ehlers Instantaneous Trendline Strategy", overlay = true, default_qty_type = strategy.percent_of_equity, default_qty_value = 100.0, pyramiding = 1, backtest_fill_limits_assumption = 1)
src = input(hl2, title="Source")
a = input(0.07, title="Alpha", step=0.01)
fr = input(false, title="Fill Trend Region")
it = na
if (na(it[2]) or na(it[1]))
    it := (src + 2 * src[1] + src[2]) / 4.0
else
    it := (a-((a*a)/4.0))*src+0.5*a*a*src[1]-(a-0.75*a*a)*src[2]+2*(1-a )*it[1]-(1-a )*(1-a )*it[2]
lag = 2.0 * it - nz(it[2])
rngFrac = input(0.35)
revPct = input(0.015)
stopType = input(title="Stop type", defval = "stop-order", options = ["stop-order", "market-order", "None"])

diff = input(0.5, title = "Spread")
LongPrice(p) =>
    LongPrice = diff == 0 ? p : floor(p / diff) * diff

ShortPrice(p) =>
    ShortPrice = diff == 0 ? p : ceil(p / diff) * diff

strategy.cancel_all()
reverseTrade = false
if stopType == "market-order"
    if  strategy.position_size > 0 and close < strategy.position_avg_price * (1 - revPct)
        strategy.order("StopLoss open short", strategy.short, 2 * strategy.position_size, limit = close - 2 * diff)
        reverseTrade := true
    if  strategy.position_size < 0 and close > strategy.position_avg_price * (1 + revPct)
        strategy.order("StopLoss open long", strategy.long, -2 * strategy.position_size, limit = close + 2 * diff)
        reverseTrade := true

if lag > it and not reverseTrade
    price = LongPrice(max(close - (high - low) * rngFrac, low))
    if strategy.position_size <= 0
        strategy.order("Open long", strategy.long, strategy.equity / price - strategy.position_size, limit = price)
        if stopType == "stop-order"
            strategy.order("StopLoss open long", strategy.short, 2 * strategy.equity / price, stop = ShortPrice(price * (1 - revPct)))
    else
        if stopType == "stop-order"
            strategy.order("StopLoss open short", strategy.short, 2 * strategy.position_size, stop = ShortPrice(strategy.position_avg_price * (1 - revPct)))
if lag < it and not reverseTrade
    price = ShortPrice(min(close - (high - low) * rngFrac, high))
    if strategy.position_size >= 0
        strategy.order("Open short", strategy.short, strategy.equity / price + strategy.position_size, limit = price)
        if stopType == "stop-order"
            strategy.order("StopLoss open short", strategy.long, 2 * strategy.equity / price, stop = LongPrice(price * (1 + revPct)))
    else
        if stopType == "stop-order"
            strategy.order("StopLoss open long", strategy.long, -2 * strategy.position_size, stop = LongPrice(strategy.position_avg_price * (1 + revPct)))


itPlot=plot(it, color=red, linewidth=1, title="Trend")
lagPlot=plot(lag, color=blue, linewidth=1, title="Trigger")
fill(itPlot, lagPlot, it < lag ? green : red,  transp=70)

// === Backtesting Dates ===
testPeriodSwitch = input(false, "Custom Backtesting Dates")
testStartYear = input(2018, "Backtest Start Year")
testStartMonth = input(9, "Backtest Start Month")
testStartDay = input(1, "Backtest Start Day")
testStartHour = input(0, "Backtest Start Hour")
testPeriodStart = timestamp(testStartYear,testStartMonth,testStartDay,testStartHour,0)
testStopYear = input(2018, "Backtest Stop Year")
testStopMonth = input(12, "Backtest Stop Month")
testStopDay = input(14, "Backtest Stop Day")
testStopHour = input(14, "Backtest Stop Hour")
testPeriodStop = timestamp(testStopYear,testStopMonth,testStopDay,testStopHour,0)
testPeriod() =>
    time >= testPeriodStart and time <= testPeriodStop ? true : false
isPeriod = testPeriodSwitch == true ? testPeriod() : true
// === /END
if not isPeriod
    strategy.cancel_all()
    strategy.close_all()