概述
本策略基于K线的形态和互动模式来判断买入和卖出信号。主要利用突破支撑和阻力进行交易,同时结合一定的K线形态来辅助决策。
策略原理
本策略主要判断以下几种K线形态:
- 小阳线:收盘价高于开盘价,实体部分较短
- 倒锤头:开盘价接近最高价,收盘价接近最低价
- 十字星:前一根K线与当前K线形成十字交叉
在判断K线形态的同时,本策略还设置了支撑位和阻力位。具体逻辑是:
- 当出现小阳线,且收盘价高于阻力位时,产生买入信号
- 当出现倒锤头,且收盘价低于支撑位时,产生卖出信号
通过这样的组合判断,可以过滤掉一些错误信号,使交易决策更加可靠。
优势分析
本策略具有以下几个优势:
- 结合图形形态和数值指标,使交易信号更加可靠
- 支撑阻力位的设置避免了无谓的反复交易
- K线形态判断相对简单,容易理解实现
- 可自定义参数,适应不同市场环境
总的来说,本策略较为简单实用,适合用来检验交易想法,也可以用来辅助人工交易。
风险分析
本策略也存在一些风险:
- K线形态判断并不完全可靠,可能出现误判
- 支撑阻力位设置不当也会影响策略效果
- 无法处理异常行情,如重大恶性事件造成的大幅波动
- 回测数据不足,可能高估了策略效果
对策主要是严格检验参数设定,调整支撑阻力位,并配合止损来控制风险。同时,必须在大量历史数据上进行回测,才能评估策略的实际效果。
优化方向
本策略主要可以从以下几个方面进行优化:
- 增加其他类型K线形态判断,丰富交易信号
- 优化支撑阻力位的计算方法,使其更加顺应市场走势
- 加入离均线距离、交易量变化等指数指标来辅助决策
- 增加机器学习算法,利用大数据自主判断图形特征
通过这些优化,可以使策略参数更加自动化、交易决策更加智能化,适应更加复杂的市场环境。
总结
本策略整体来说较为简单实用,特别适合个人交易者检验想法以及辅助决策。结合K线形态和支撑阻力判断产生交易信号,可以有效过滤误判。通过一定优化,本策略可以成为一个相对可靠的量化交易系统。
策略源码
/*backtest
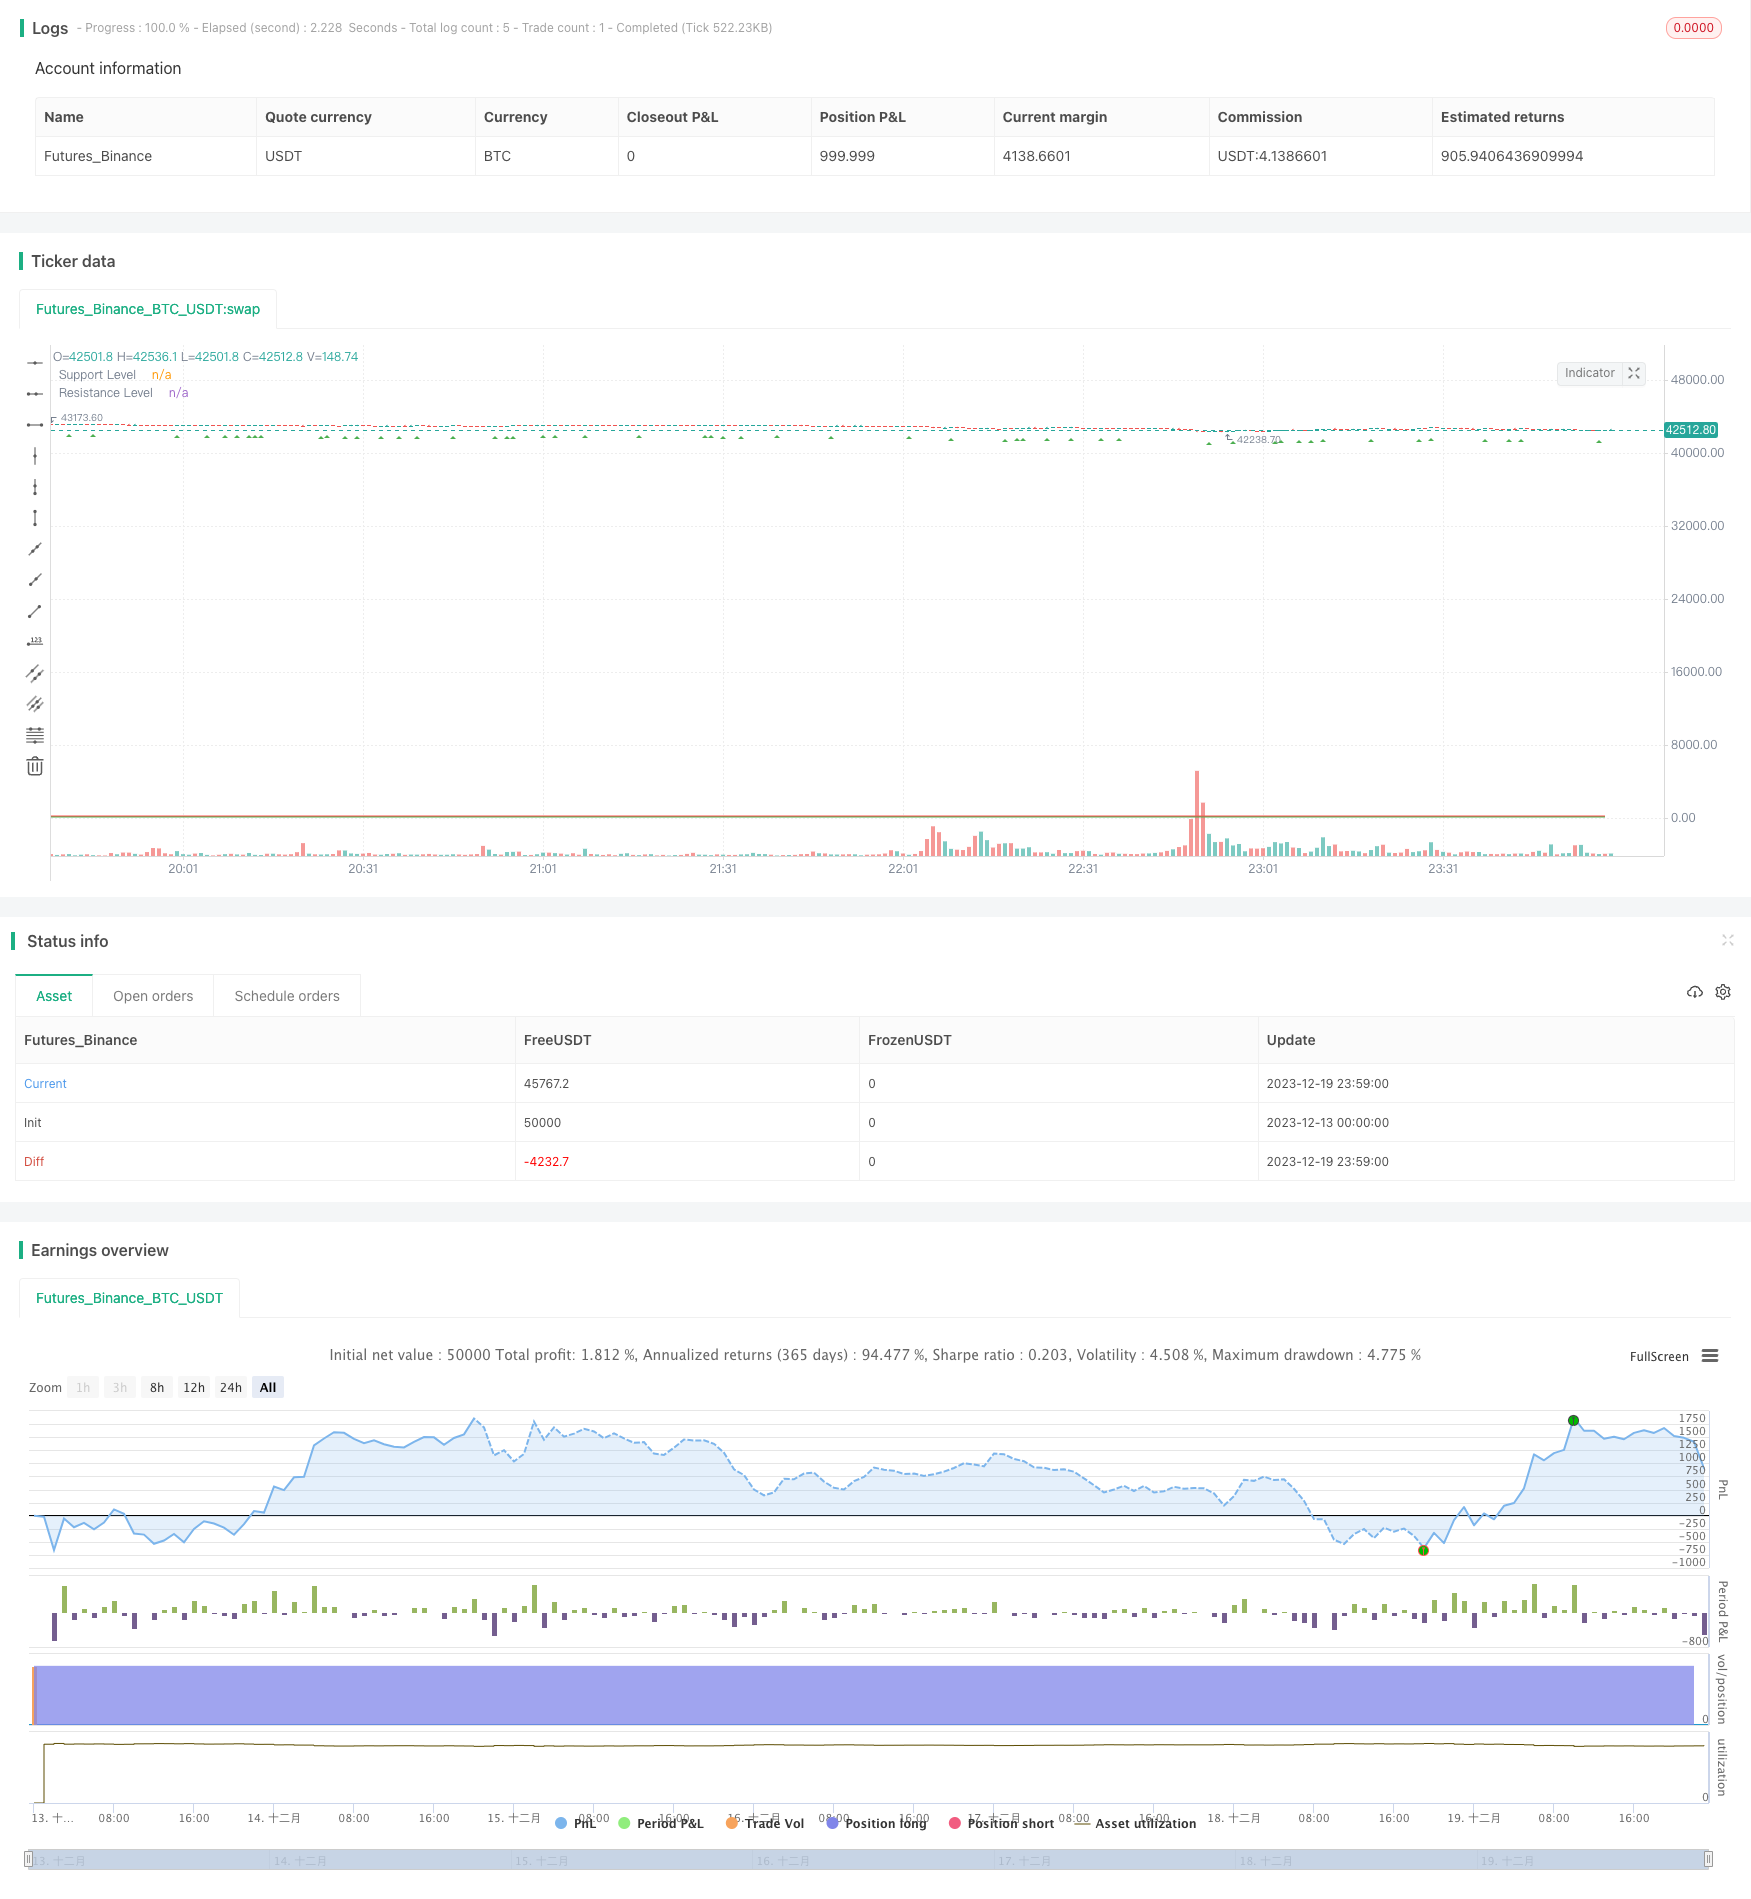
start: 2023-12-13 00:00:00
end: 2023-12-20 00:00:00
period: 1m
basePeriod: 1m
exchanges: [{"eid":"Futures_Binance","currency":"BTC_USDT"}]
*/
//@version=5
strategy("Candlestick Pattern Strategy", overlay=true)
// Input for support and resistance levels
supportLevel = input(100, title="Support Level")
resistanceLevel = input(200, title="Resistance Level")
// Detecting Candlestick Patterns
isDoji = close == open
isPressure = close < open and open - close > close - open
isInvertedHammer = close > open and low == (close < open ? close : open) and close - open < 0.1 * (high - low)
isHammer = close > open and close - open > 0.6 * (high - low)
// Buy and Sell Conditions
buyCondition = isHammer and close > resistanceLevel
sellCondition = isInvertedHammer and close < supportLevel
// Strategy Logic
strategy.entry("Buy", strategy.long, when = buyCondition)
strategy.close("Buy", when = sellCondition)
// Plot Buy and Sell signals on the chart
plotshape(series=buyCondition, title="Buy Signal", color=color.green, style=shape.triangleup, location=location.belowbar)
plotshape(series=sellCondition, title="Sell Signal", color=color.red, style=shape.triangledown, location=location.abovebar)
// Plot Support and Resistance levels
plot(supportLevel, color=color.green, title="Support Level")
plot(resistanceLevel, color=color.red, title="Resistance Level")