概述
该策略通过结合123反转指标和RAVI指标来产生交易信号。其中,123反转属于反转型策略,利用股票价格连续两天走势判断未来价格走势。RAVI指标则判断价格是否进入超买超卖区间。策略通过两者信号的综合判断来决定做多做空。
策略原理
123反转
该指标基于随机指标K值。具体来说,当前日收盘价低于前两日,且9日随机慢线低于50时做多。当前日收盘价高于前两日,且9日随机快线高于50时做空。这样通过反转点确认进场。
RAVI指标
该指标通过快线和慢线的离差来判断买卖。具体为,7日均线和65日均线离差,当大于某一参数时做多,小于某一参数时做空。通过快慢线金叉死叉来判断超买超卖区间。
策略信号
当123反转和RAVI同向做多做空时产生信号。做多信号为两指标同为1,做空信号为两指标同为-1。这样通过双重指标确认,避免单一指标的错误信号。
优势分析
- 利用两种指标进行组合,可以提高信号准确性,避免错误信号
- 123反转采用K线信息,RAVI采用均线信息,多角度判断市场
- RAVI参数可调,可以针对不同品种和市场环境优化
- 反转加趋势,既可以捕捉反转也可以跟随趋势
风险及优化
- 双重指标组合,容易产生信号不一致。可以考虑价差参数,当两指标价差在某参数内也可出信号
- 123反转属于高频策略,需要 Combine 与其他低频策略,降低交易频率
- RAVI擅长捕捉中长线趋势, Combine 短线指标可提高策略抗风险能力
总结
该策略综合考虑反转因素和趋势因素,通过双指标确认减少错误信号发出概率。下一步,可以引入机器学习算法,实现自适应参数优化。或考虑策略组合,与其他策略类型形成组合,在保持收益的同时降低最大回撤。
策略源码
/*backtest
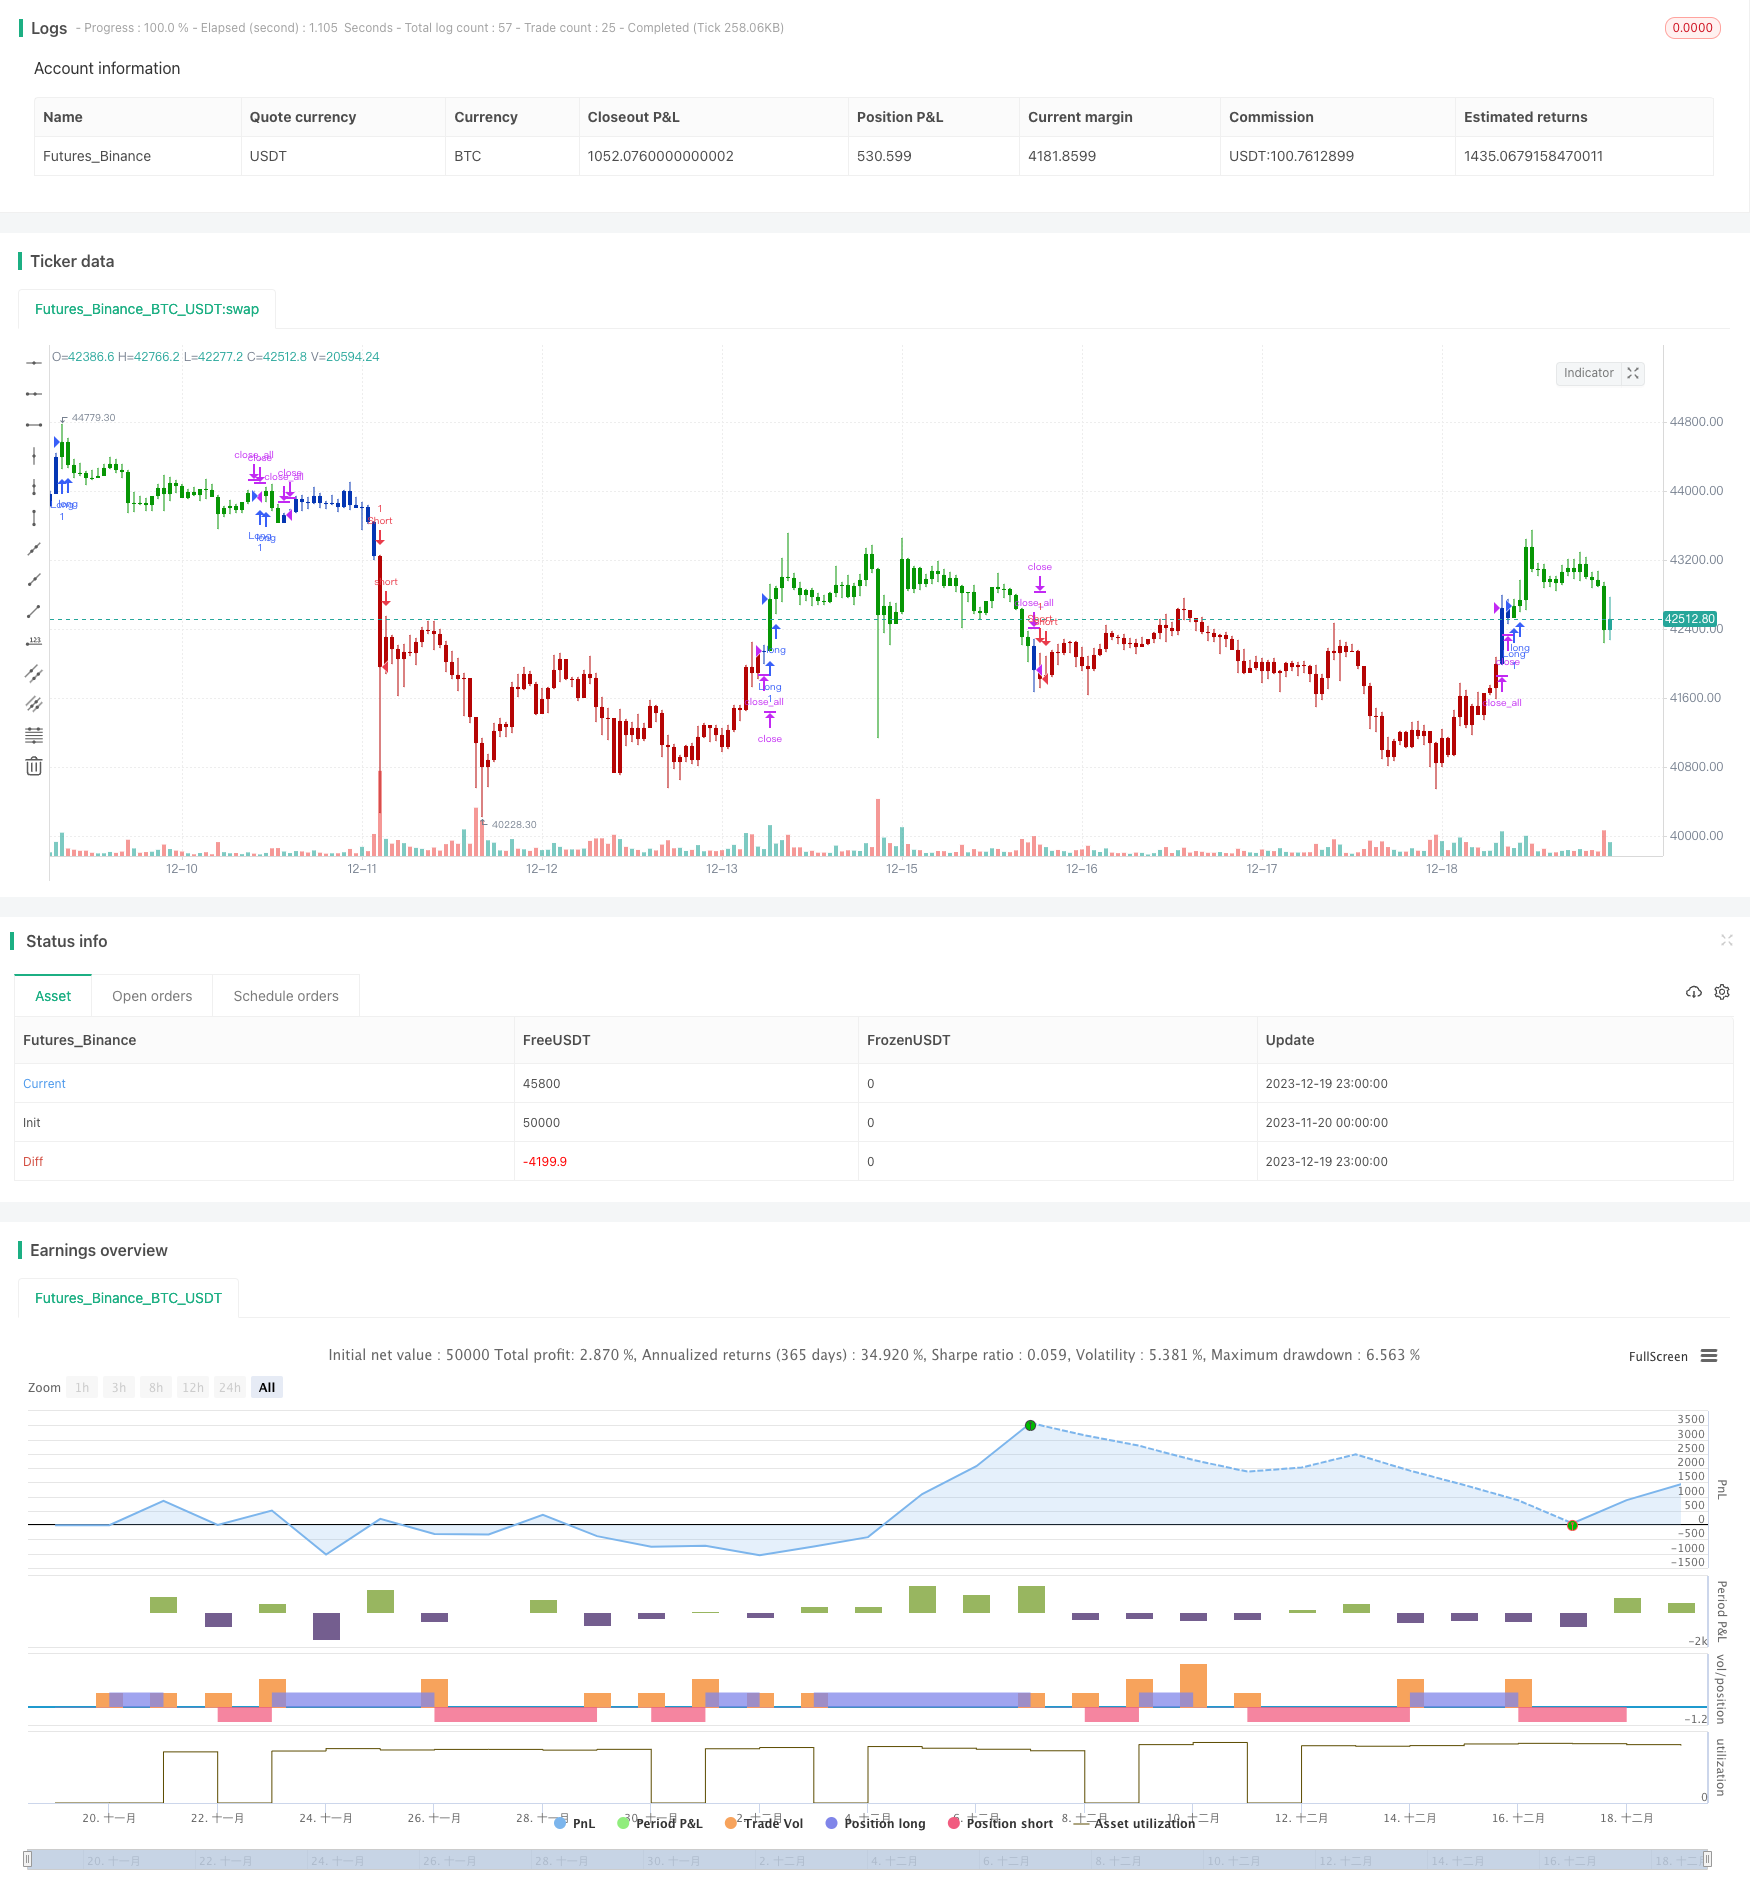
start: 2023-11-20 00:00:00
end: 2023-12-20 00:00:00
period: 1h
basePeriod: 15m
exchanges: [{"eid":"Futures_Binance","currency":"BTC_USDT"}]
*/
//@version=4
////////////////////////////////////////////////////////////
// Copyright by HPotter v1.0 31/05/2021
// This is combo strategies for get a cumulative signal.
//
// First strategy
// This System was created from the Book "How I Tripled My Money In The
// Futures Market" by Ulf Jensen, Page 183. This is reverse type of strategies.
// The strategy buys at market, if close price is higher than the previous close
// during 2 days and the meaning of 9-days Stochastic Slow Oscillator is lower than 50.
// The strategy sells at market, if close price is lower than the previous close price
// during 2 days and the meaning of 9-days Stochastic Fast Oscillator is higher than 50.
//
// Second strategy
// The indicator represents the relative convergence/divergence of the moving
// averages of the financial asset, increased a hundred times. It is based on
// a different principle than the ADX. Chande suggests a 13-week SMA as the
// basis for the indicator. It represents the quarterly (3 months = 65 working days)
// sentiments of the market participants concerning prices. The short moving average
// comprises 10% of the one and is rounded to seven.
//
// WARNING:
// - For purpose educate only
// - This script to change bars colors.
////////////////////////////////////////////////////////////
Reversal123(Length, KSmoothing, DLength, Level) =>
vFast = sma(stoch(close, high, low, Length), KSmoothing)
vSlow = sma(vFast, DLength)
pos = 0.0
pos := iff(close[2] < close[1] and close > close[1] and vFast < vSlow and vFast > Level, 1,
iff(close[2] > close[1] and close < close[1] and vFast > vSlow and vFast < Level, -1, nz(pos[1], 0)))
pos
RAVI(LengthMAFast, LengthMASlow, TradeLine) =>
pos = 0.0
xMAF = sma(close, LengthMAFast)
xMAS = sma(close, LengthMASlow)
xRAVI = ((xMAF - xMAS) / xMAS) * 100
pos:= iff(xRAVI > TradeLine, 1,
iff(xRAVI < TradeLine, -1, nz(pos[1], 0)))
pos
strategy(title="Combo Backtest 123 Reversal & Range Action Verification Index (RAVI)", shorttitle="Combo", overlay = true)
line1 = input(true, "---- 123 Reversal ----")
Length = input(14, minval=1)
KSmoothing = input(1, minval=1)
DLength = input(3, minval=1)
Level = input(50, minval=1)
//-------------------------
line2 = input(true, "---- Range Action Verification Index (RAVI) ----")
LengthMAFast = input(title="Length MA Fast", defval=7)
LengthMASlow = input(title="Length MA Slow", defval=65)
TradeLine = input(0.14, step=0.01)
reverse = input(false, title="Trade reverse")
posReversal123 = Reversal123(Length, KSmoothing, DLength, Level)
posRAVI = RAVI(LengthMAFast, LengthMASlow, TradeLine)
pos = iff(posReversal123 == 1 and posRAVI == 1 , 1,
iff(posReversal123 == -1 and posRAVI == -1, -1, 0))
possig = iff(reverse and pos == 1, -1,
iff(reverse and pos == -1 , 1, pos))
if (possig == 1 )
strategy.entry("Long", strategy.long)
if (possig == -1 )
strategy.entry("Short", strategy.short)
if (possig == 0)
strategy.close_all()
barcolor(possig == -1 ? #b50404: possig == 1 ? #079605 : #0536b3 )