概述
双移动平均线趋势跟踪策略是一种跟踪股票价格趋势的量化交易策略。该策略使用双指数移动平均线系统判断价格趋势方向,并结合ADX指标判断趋势力度,在中长线上捕捉价格趋势。
策略原理
该策略主要基于双指数移动平均线系统判断价格趋势方向。策略使用快慢两个不同参数的EMA,快线EMA1反应价格变化更迅速,慢线EMA2响应价格变化更滞后。当快线上穿慢线时为买入信号,表示价格开始上升;当快线下穿慢线时为卖出信号,表示价格开始下跌。
此外,策略还引入ADX指标判断趋势力度。ADX通过计算价格波动来判断趋势的力度。当ADX值上升,说明趋势在加强;当ADX值下降,说明趋势在减弱。策略通过ADX指标设置交易过滤条件,只在趋势力度较强时才发出交易信号。
具体来说,策略的交易信号生成规则为:
- 快线上穿慢线时做多,快线下穿慢线时做空
- ADX>25时才允许做多做空
这样可以有效过滤掉趋势力度较弱的无效信号,进一步提高交易系统的稳定性。
策略优势
该策略主要具有以下几个优势:
捕捉中长线价格趋势:双EMA平均线系统能够有效判断价格中长线趋势,避免被短期市场噪音干扰。
过滤假断裂:通过ADX指标判断趋势力度,避免在趋势转折点附近出现的假断裂带来不必要的亏损。
参数优化空间大:快慢线参数组合、ADX参数等都有优化空间,可以通过组合参数获取更好的交易效果。
适应性强:该策略适用于大多数股票和时间周期,已经经过了多种市场的验证。
易于实施:该策略只需要简单平均线指标,资源占用少,易于编程实现,实际运用成本低。
策略风险
该策略也存在一定的风险,主要集中在以下几个方面:
趋势反转风险:任何趋势策略都无法完美判断趋势反转点,在真正趋势反转来临时难免会承受较大的亏损。
参数优化过度风险:参数优化到极致也会导致策略对历史数据过度拟合,这会降低策略的稳定性和实战效果。
突发事件风险:重大突发事件会打破原有的价格趋势模式,这时移动平均线指标会失效,需要人工干预或设置止损来控制亏损。
针对以上风险,我们可以从以下几个方面进行优化:
引入附加指标判断价格转折点。例如引入成交量,在价格转折的同时成交量会放大。
适当放宽ADX参数,确保在趋势初期也能把握机会。同时也可以引入MACD等辅助判断指标。
对参数组合进行多组训练测试,选择稳定性和实战效果都良好的参数。避免单一参数组的优化过度风险。
策略优化方向
该策略还有一些可优化的方向:
引入止损机制:设置移动止损或百分比止损,可以在趋势反转时主动止损,避免持仓亏损过大。
结合交易量指标:例如成交量,可以避免在成交量放大的价格转折点出现错误信号。
参数自适应优化:让指标的参数能够根据实时市场变化进行自适应调整,而不是固定静态参数,这可以大大提高策略的稳定性。
引入机器学习:使用机器学习算法分析大量历史数据,确定移动平均线和ADX的参数,甚至可以预测价格的未来走势。这是移动平均线策略演化的一个方向。
跨周期优化:不同交易周期Parameter设置可以不一样,可以测试出每种周期下参数的最优配置。
总结
双移动平均线趋势跟踪策略整体来说是一种成熟稳定的策略思路。该策略通过双EMA平均线系统捕捉价格中长线趋势,并有ADX指标来过滤信号,能够有效把握股票价格趋势,避免被短期市场噪音干扰。与此同时,该策略也存在一定的风险,需要对参数组合与止损方法进行优化,甚至可以引入更多辅助指标和机器学习算法来提升策略的稳定性。总的来说,双移动平均线趋势跟踪策略具有良好的平衡性,是一种适合中长线投资者使用的量化策略思路。
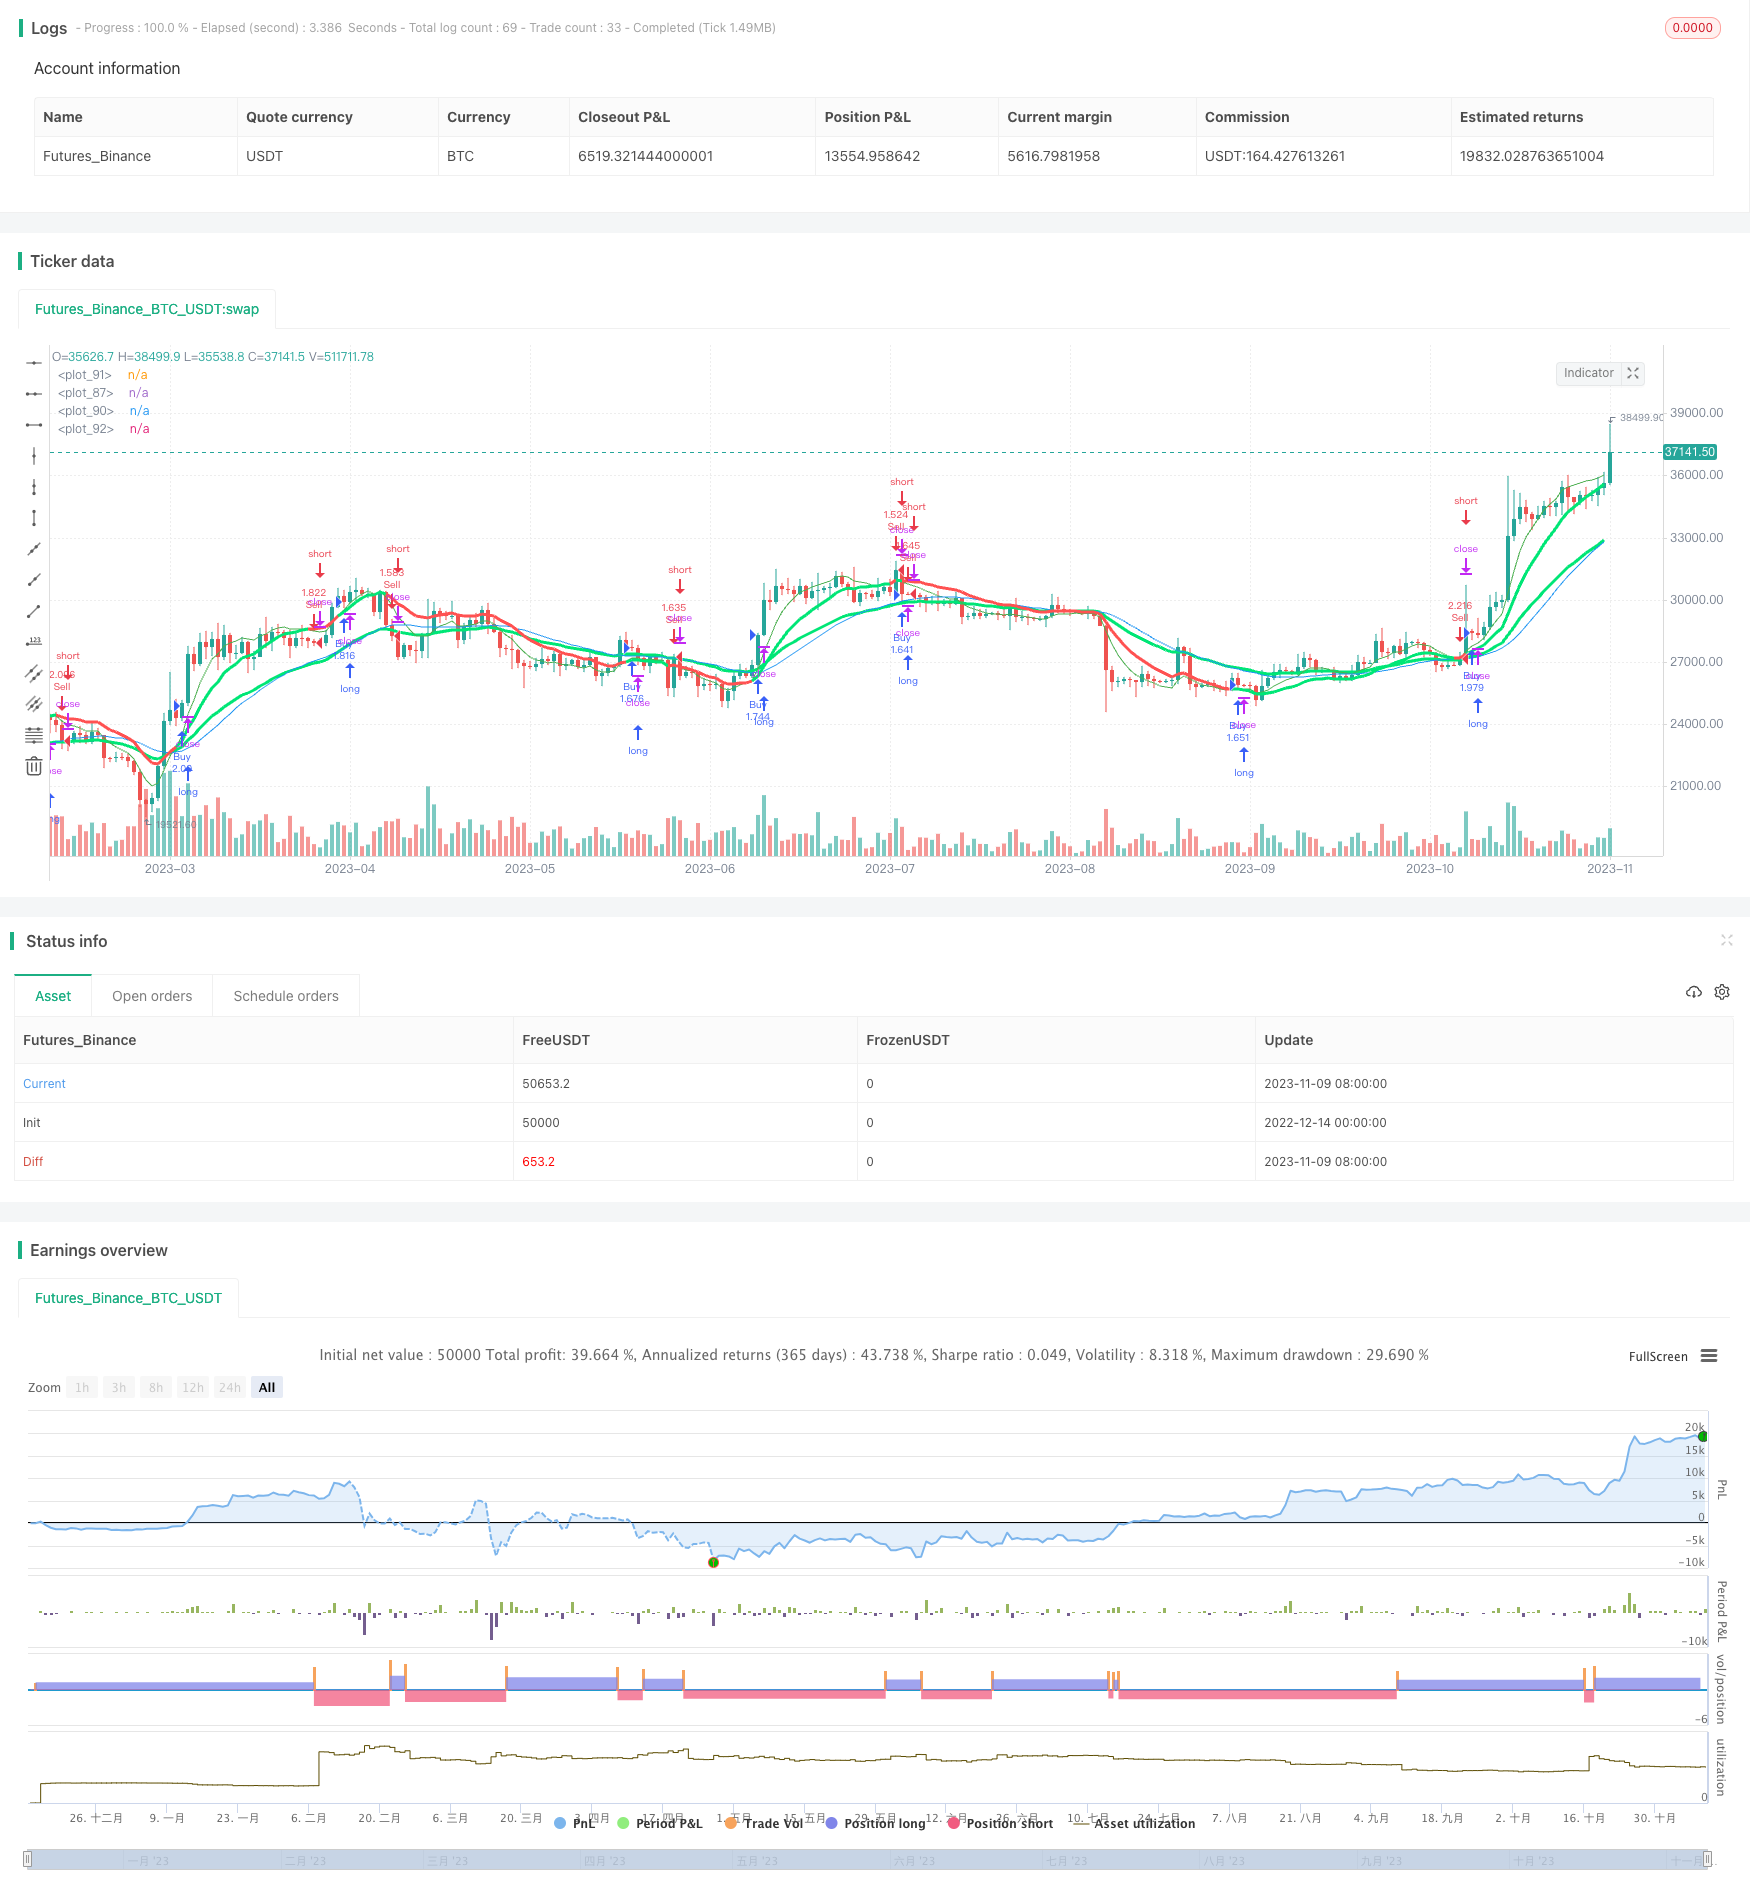
/*backtest
start: 2022-12-14 00:00:00
end: 2023-11-10 00:00:00
period: 1d
basePeriod: 1h
exchanges: [{"eid":"Futures_Binance","currency":"BTC_USDT"}]
*/

//@version=3
strategy("Kitaec Strategy4", shorttitle = "Kitaec str4", overlay = true, default_qty_type = strategy.percent_of_equity, default_qty_value = 100, pyramiding = 0)

//Settings
needlong = input(true, defval = true, title = "Long")
needshort = input(true, defval = true, title = "Short")
capital = input(100, defval = 100, minval = 1, maxval = 10000, title = "Lot")
len = input(14, defval=14, minval=1, maxval=1000, title="Smoothing")
len2 = input(14, defval=14, minval=1, maxval=1000, title="Smoothing2")
len3=input(550)
src = close
ema1=ema(src, len)
ema2=ema(ema1, len2)
d=ema1-ema2
zlema=ema1+d

ema21=ema(src, (len/3)*2)
ema22=ema(ema21, (len2/3)*2)
d2=ema21-ema22
zlema2=ema21+d2

ema31=ema(src, len3)
ema32=ema(ema21, len3)
d3=ema31-ema32
zlema3=ema31+d2

fromyear = input(1900, defval = 1900, minval = 1900, maxval = 2100, title = "From Year")
toyear = input(2100, defval = 2100, minval = 1900, maxval = 2100, title = "To Year")
frommonth = input(01, defval = 01, minval = 01, maxval = 12, title = "From Month")
tomonth = input(12, defval = 12, minval = 01, maxval = 12, title = "To Month")
fromday = input(01, defval = 01, minval = 01, maxval = 31, title = "From day")
today = input(31, defval = 31, minval = 01, maxval = 31, title = "To day")

//MAs
//ma1 = security(tickerid, "60", vwma(src, len)[1])
//ma2 = security(tickerid, "120", vwma(src, len)[1])
//plot(ma1, linewidth = 2, color = blue, title = "MA")
//plot(ma2, linewidth = 2, color = red, title = "MA2")

// ADX
lenadx = 14
lensig = 14
limadx = 18

up = change(high)
down = -change(low)
trur = rma(tr, lenadx)
plus = fixnan(100 * rma(up > down and up > 0 ? up : 0, lenadx) / trur)
minus = fixnan(100 * rma(down > up and down > 0 ? down : 0, lenadx) / trur)
sum = plus + minus
adx = 100 * rma(abs(plus - minus) / (sum == 0 ? 1 : sum), lensig)
adx2 = ema(adx, 14)
adx2i = ema(adx2,14)
dadx2 = adx2 - adx2i
zladx2 = adx2 + dadx2
plus2 = ema(plus, 14)
plus2i = ema (plus2, 14)
dplus2 = plus2 - plus2i
zlplus2 = plus2 + dplus2

minus2 = ema(minus, 14)
minus2i = ema (minus2, 14)
dminus2 = minus2 - minus2i
zlminus2 = minus2 + dminus2

vwma = vwma(close, 150)
vwma2 = ema(vwma, 9)
vwma2i = ema(vwma2, 9)
dvwma2 = vwma2 - vwma2i
zlvwma2 = vwma2 + dvwma2


rmax=rma(src, len)
rmax2=rma(rmax, len2)
rmd=rmax-rmax2
zlrmax=rmax+rmd
rmaxz=rma(src, (len/3)*2)
rmaxz2=rma(rmaxz, (len2/3)*2)
rmzd=rmaxz-rmaxz2
zlrmaxz=rmaxz+rmzd
rmaxcol2=zlrmaxz[1] > zlema2[1] ? red:lime
rmaxcol= zlrmax[1] > zlema[1] ? red:lime


rmazlema3=rma(zlema3, 100)
plot(rmazlema3, color=gray, linewidth=2)
plot(zlema, color=green)
plot(zlema2, color=yellow)
plot(zlema3, color=teal, linewidth=2)
plot(ema2, color=na)
plot(rmax, color=rmaxcol2, linewidth=3)
plot(zlrmax, color=rmaxcol, linewidth=3)


//Trading
size = strategy.position_size
lot = 0.0
lot := size != size[1] ? strategy.equity / close * capital / 100 : lot[1]

if zlrmax[1] < zlema[1]
    strategy.entry("Buy", strategy.long, needlong ? lot : 0, when = (time > timestamp(fromyear, frommonth, fromday, 00, 00) and time < timestamp(toyear, tomonth, today, 23, 59)))
if zlrmax[1] > zlema[1]
    strategy.entry("Sell", strategy.short, needshort ? lot : 0, when = (time > timestamp(fromyear, frommonth, fromday, 00, 00) and time < timestamp(toyear, tomonth, today, 23, 59)))