概述
EMA黄金交叉回调策略是一种基于EMA指标的量化交易策略。该策略使用三条不同周期的EMA曲线构建交易信号,并结合价格回调机制设定止损止盈,实现自动化交易。
策略原理
该策略使用三条EMA曲线,分别是:
- EMA1:用于判断价格回调支撑/阻力位,周期较短,默认为33周期。
- EMA2:用于过滤掉部分反转信号,周期为EMA1的5倍,默认为165周期。
- EMA3:用于判断总体趋势方向,周期为EMA1的11倍,默认为365周期。
交易信号的产生遵循以下逻辑:
多头信号:价格上穿EMA1constitutes后发生回调,在EMA1上方形成更高低点,回调幅度未触及EMA2。满足条件后,在再次上穿EMA1时做多。
空头信号:价格下穿EMA1后发生回调,在EMA1下方形成更低高点,回调幅度未触及EMA2。满足条件后,在再次下穿EMA1时做空。
止损方式为回调最低价/最高价。止盈设置为止损的2倍。
策略优势
该策略具有以下优势:
- 使用EMA指标构建交易信号,可靠性较高。
- 结合价格回调机制,可有效避免被套。
- 停损点设置在之前高低位,有效控制风险。
- 按照止盈止损比例设置止盈点,满足盈亏比要求。
- 可根据市场调整EMA参数,适应不同周期。
策略风险
该策略也存在一定风险:
- EMA指标存在滞后,可能错过趋势反转点。
- 回调范围过大超过EMA2 may generate false signals。
- 趋势行情中止损可能被突破。
- 参数设置不当可能导致过于频繁交易或漏失机会。
可以通过调整EMA周期、回调限制范围等方法优化参数。也可以结合其他指标过滤信号。
策略优化方向
该策略还可从以下几个方面进行优化:
- 增加趋势指标判断,避免逆势交易。例如加入MACD。
- 添加交易量指标,避免虚假突破。例如加入OBV。
- 优化EMA周期参数,或采用自适应EMA。
- 结合词袋模型等机器学习方法动态优化参数。
- 加入模型预测,设置自适应止损止盈。
总结
EMA黄金交叉回调策略通过构建三EMA交易系统,结合价格回调特性设定止盈止损,实现了自动化交易。该策略有效控制了交易风险,且可根据市场通过调整参数进行优化。总体来说,该策略逻辑合理,可实际应用。未来可从趋势判断、参数优化、风险控制等方面进行进一步优化。
策略源码
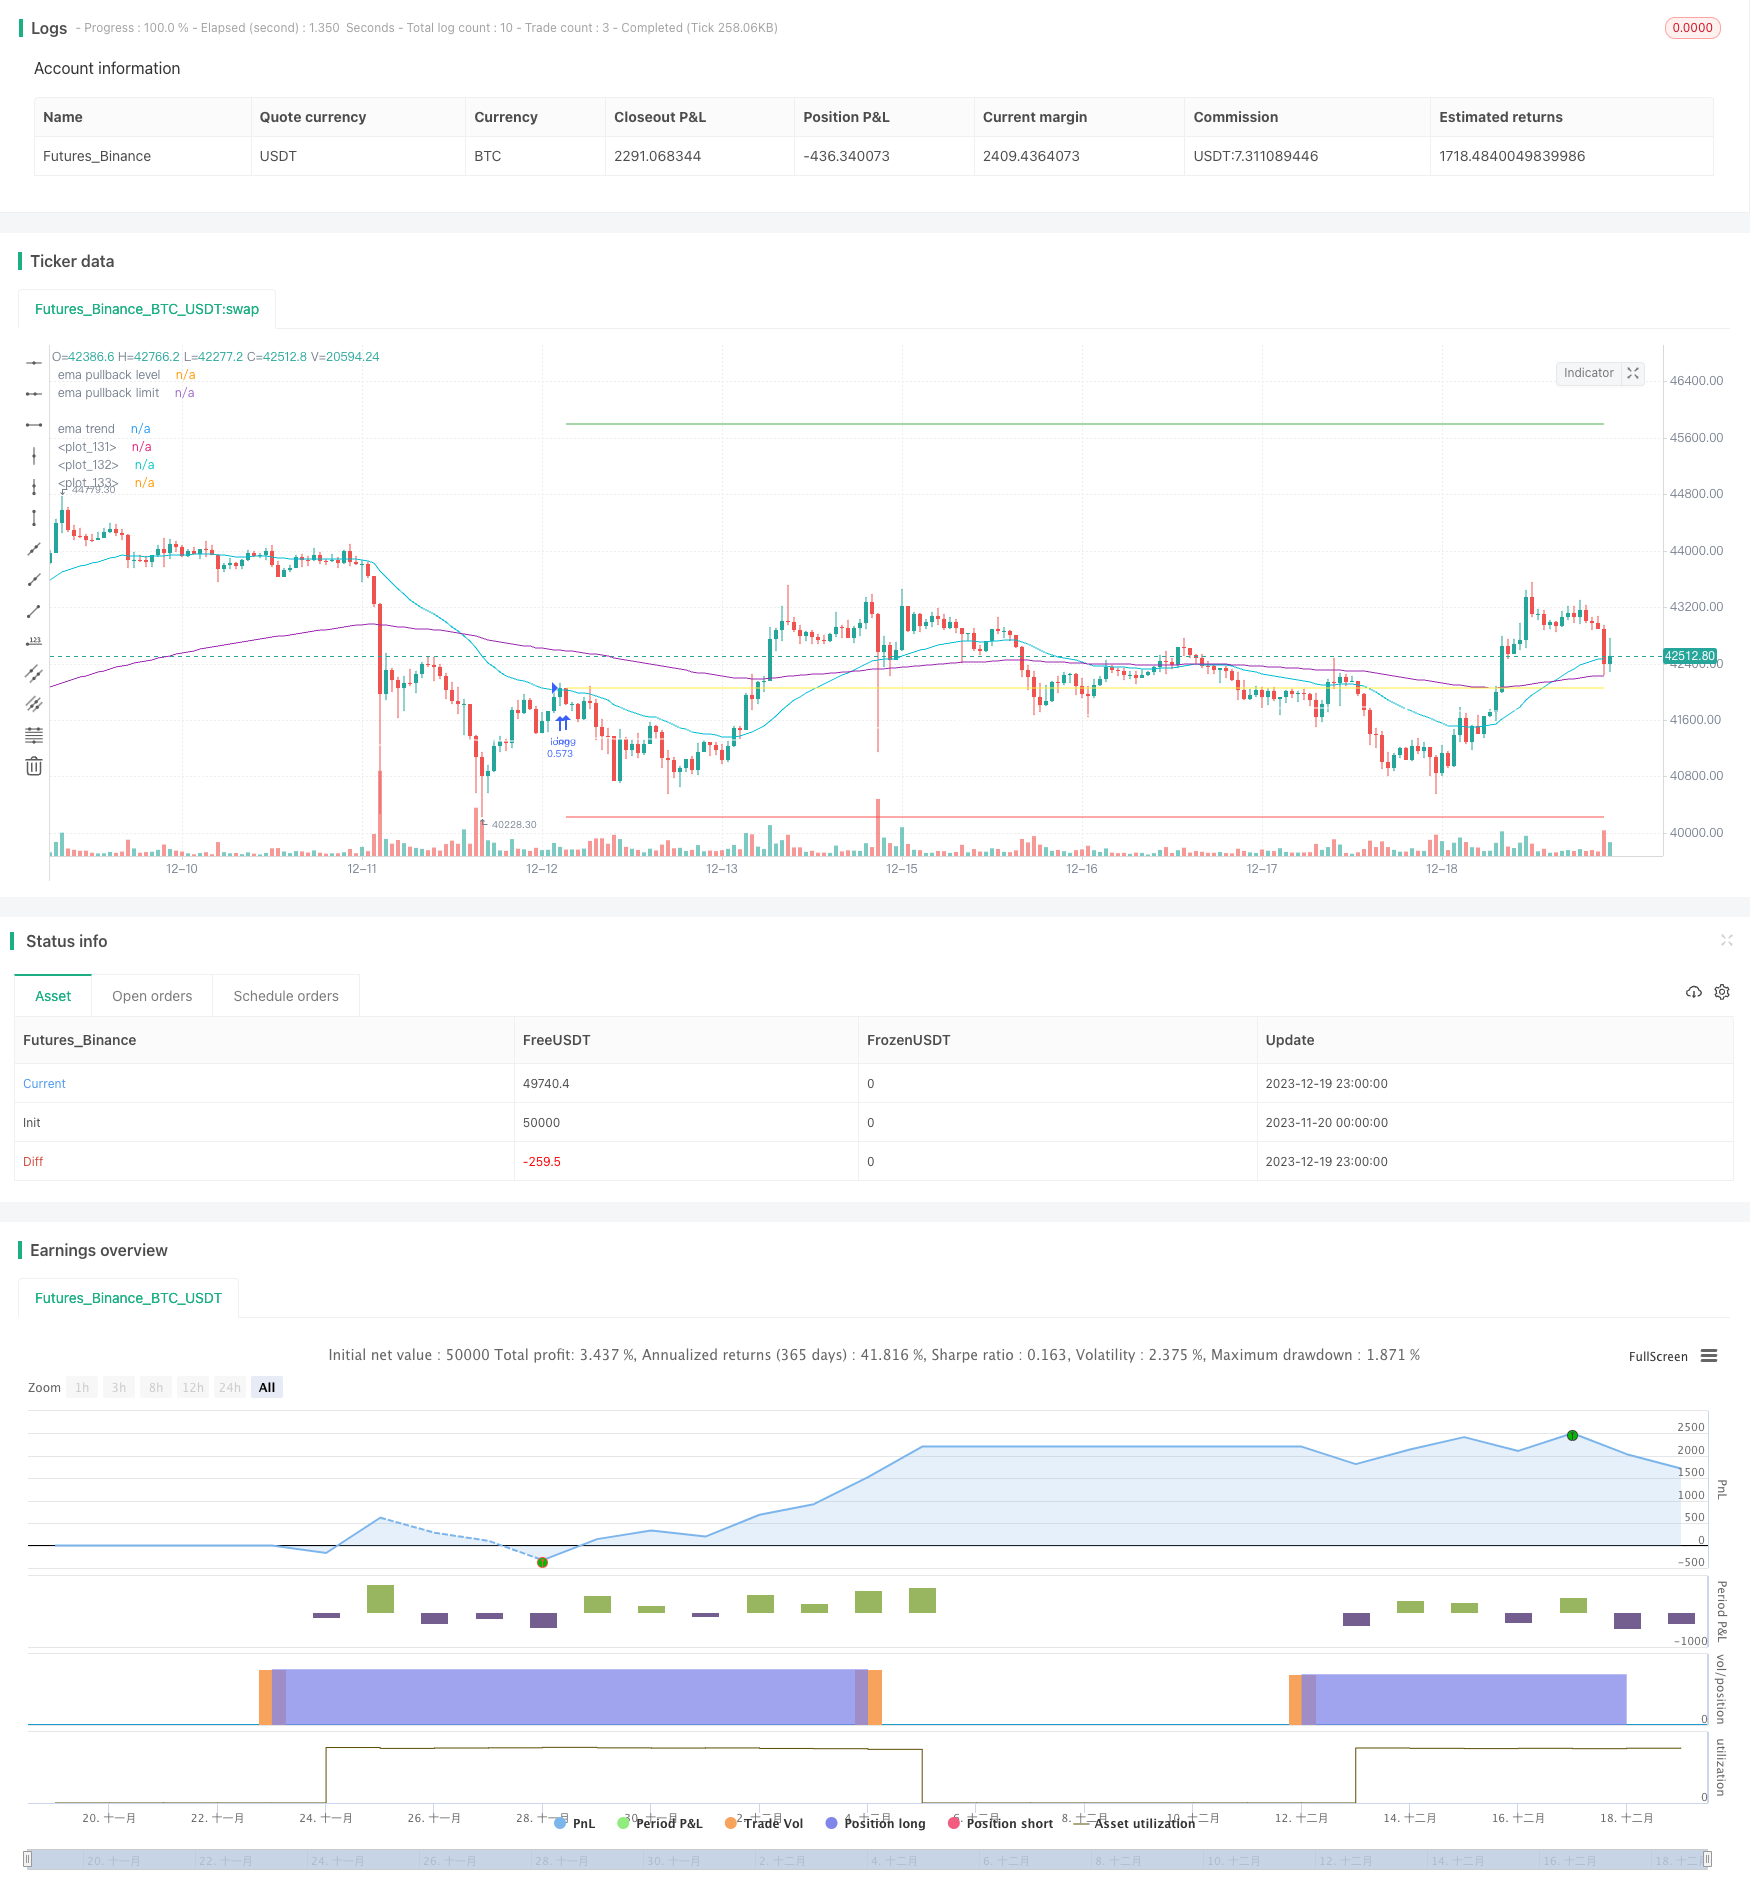
/*backtest
start: 2023-11-20 00:00:00
end: 2023-12-20 00:00:00
period: 1h
basePeriod: 15m
exchanges: [{"eid":"Futures_Binance","currency":"BTC_USDT"}]
*/

// This source code is subject to the terms of the Mozilla Public License 2.0 at https://mozilla.org/MPL/2.0/
// created by Space Jellyfish
//@version=4

strategy("EMA pullback strategy", overlay = true, initial_capital=10000, commission_value = 0.075)

target_stop_ratio = input(title="Take Profit Stop Loss ratio", type=input.float, defval=2.06, minval=0.5, maxval=100)
riskLimit_low =  input(title="lowest risk per trade", type=input.float, defval=0.008, minval=0, maxval=100)
riskLimit_high =  input(title="highest risk per trade", type=input.float, defval=0.02, minval=0, maxval=100)
//give up the trade, if the risk is smaller than limit, adjust position size if risk is bigger than limit

ema_pullbackLevel_period = input(title="EMA1 for pullback level Period", type=input.integer, defval=33, minval=1, maxval=10000)
ema_pullbackLimiit_period = input(title="EMA2 for pullback limit Period", type=input.integer, defval=165, minval=1, maxval=10000)
ema_trend_period = input(title="EMA3 for trend Period", type=input.integer, defval=365, minval=1, maxval=10000)

startDate = input(title="Start Date", type=input.integer, defval=1, minval=1, maxval=31)
startMonth = input(title="Start Month", type=input.integer, defval=1, minval=1, maxval=12)
startYear = input(title="Start Year", type=input.integer, defval=2018, minval=2008, maxval=2200)

inDateRange = (time >= timestamp(syminfo.timezone, startYear, startMonth, startDate, 0, 0))

ema_pullbackLevel = ema(close, ema_pullbackLevel_period)
ema_pullbackLimit = ema(close, ema_pullbackLimiit_period)
ema_trendDirection = ema(close, ema_trend_period)

//ema pullback
float pricePullAboveEMA_maxClose = na
float pricePullAboveEMA_maxHigh = na

float pricePullBelowEMA_minClose = na
float pricePullBelowMA_minLow = na

if(crossover(close, ema_pullbackLevel))
    pricePullAboveEMA_maxClose := close
    pricePullAboveEMA_maxHigh := high
else
    pricePullAboveEMA_maxClose := pricePullAboveEMA_maxClose[1]
    pricePullAboveEMA_maxHigh := pricePullAboveEMA_maxHigh[1]

if(close > pricePullAboveEMA_maxClose)
    pricePullAboveEMA_maxClose := close
if(high > pricePullAboveEMA_maxHigh)
    pricePullAboveEMA_maxHigh := high

if(crossunder(close, ema_pullbackLevel))
    pricePullBelowEMA_minClose := close
    pricePullBelowMA_minLow := low
else
    pricePullBelowEMA_minClose :=pricePullBelowEMA_minClose[1]
    pricePullBelowMA_minLow:=pricePullBelowMA_minLow[1]

if(close < pricePullBelowEMA_minClose)
    pricePullBelowEMA_minClose := close
if(low < pricePullBelowMA_minLow)
    pricePullBelowMA_minLow := low


long_strategy = crossover(close, ema_pullbackLevel) and pricePullBelowEMA_minClose < ema_pullbackLimit and ema_pullbackLevel>ema_trendDirection
short_strategy = crossunder(close, ema_pullbackLevel) and pricePullAboveEMA_maxClose > ema_pullbackLimit and ema_pullbackLevel<ema_trendDirection


var open_long_or_short = 0// long = 10000, short = -10000, no open = 0

//check if position is closed
if(strategy.position_size == 0)
    open_long_or_short := 0
else
    open_long_or_short := open_long_or_short[1]

float risk_long = na
float risk_short = na
float stopLoss = na
float takeProfit = na
float entry_price = na

float entryContracts = 0


risk_long := risk_long[1]
risk_short := risk_short[1]

//open a position determine the position size
if (strategy.position_size == 0 and long_strategy and inDateRange)
    risk_long := (close - pricePullBelowMA_minLow) / close

    if(risk_long < riskLimit_high)
        entryContracts := strategy.equity / close
    else
        entryContracts := (strategy.equity * riskLimit_high / risk_long)/close

    if(risk_long > riskLimit_low)
        strategy.entry("long", strategy.long, qty = entryContracts, when = long_strategy)


    open_long_or_short := 10000

if (strategy.position_size == 0 and short_strategy and inDateRange)
    risk_short := (pricePullAboveEMA_maxHigh - close) / close
    if(risk_short < riskLimit_high)
        entryContracts := strategy.equity / close
    else
        entryContracts := (strategy.equity * riskLimit_high / risk_short)/close

    if(risk_short > riskLimit_low)
        strategy.entry("short", strategy.short, qty = entryContracts, when = short_strategy)


    open_long_or_short := -10000

//take profit / stop loss
if(open_long_or_short == 10000)

    stopLoss :=   strategy.position_avg_price*(1 - risk_long)
    takeProfit :=  strategy.position_avg_price*(1 + target_stop_ratio * risk_long)
    entry_price := strategy.position_avg_price
    strategy.exit("Long exit","long", limit = takeProfit , stop = stopLoss)

if(open_long_or_short == -10000)
    stopLoss :=  strategy.position_avg_price*(1 + risk_short)
    takeProfit :=  strategy.position_avg_price*(1 - target_stop_ratio * risk_short)
    entry_price := strategy.position_avg_price
    strategy.exit("Short exit","short", limit = takeProfit, stop = stopLoss)


plot(ema_pullbackLevel, color=color.aqua,  title="ema pullback level")
plot(ema_pullbackLimit, color=color.purple,  title="ema pullback limit")
plot(ema_trendDirection, color=color.white,  title="ema trend")

plot(entry_price, color = color.yellow, linewidth = 1, style = plot.style_linebr)
plot(stopLoss, color = color.red, linewidth = 1, style = plot.style_linebr)
plot(takeProfit, color = color.green, linewidth = 1, style = plot.style_linebr)


//