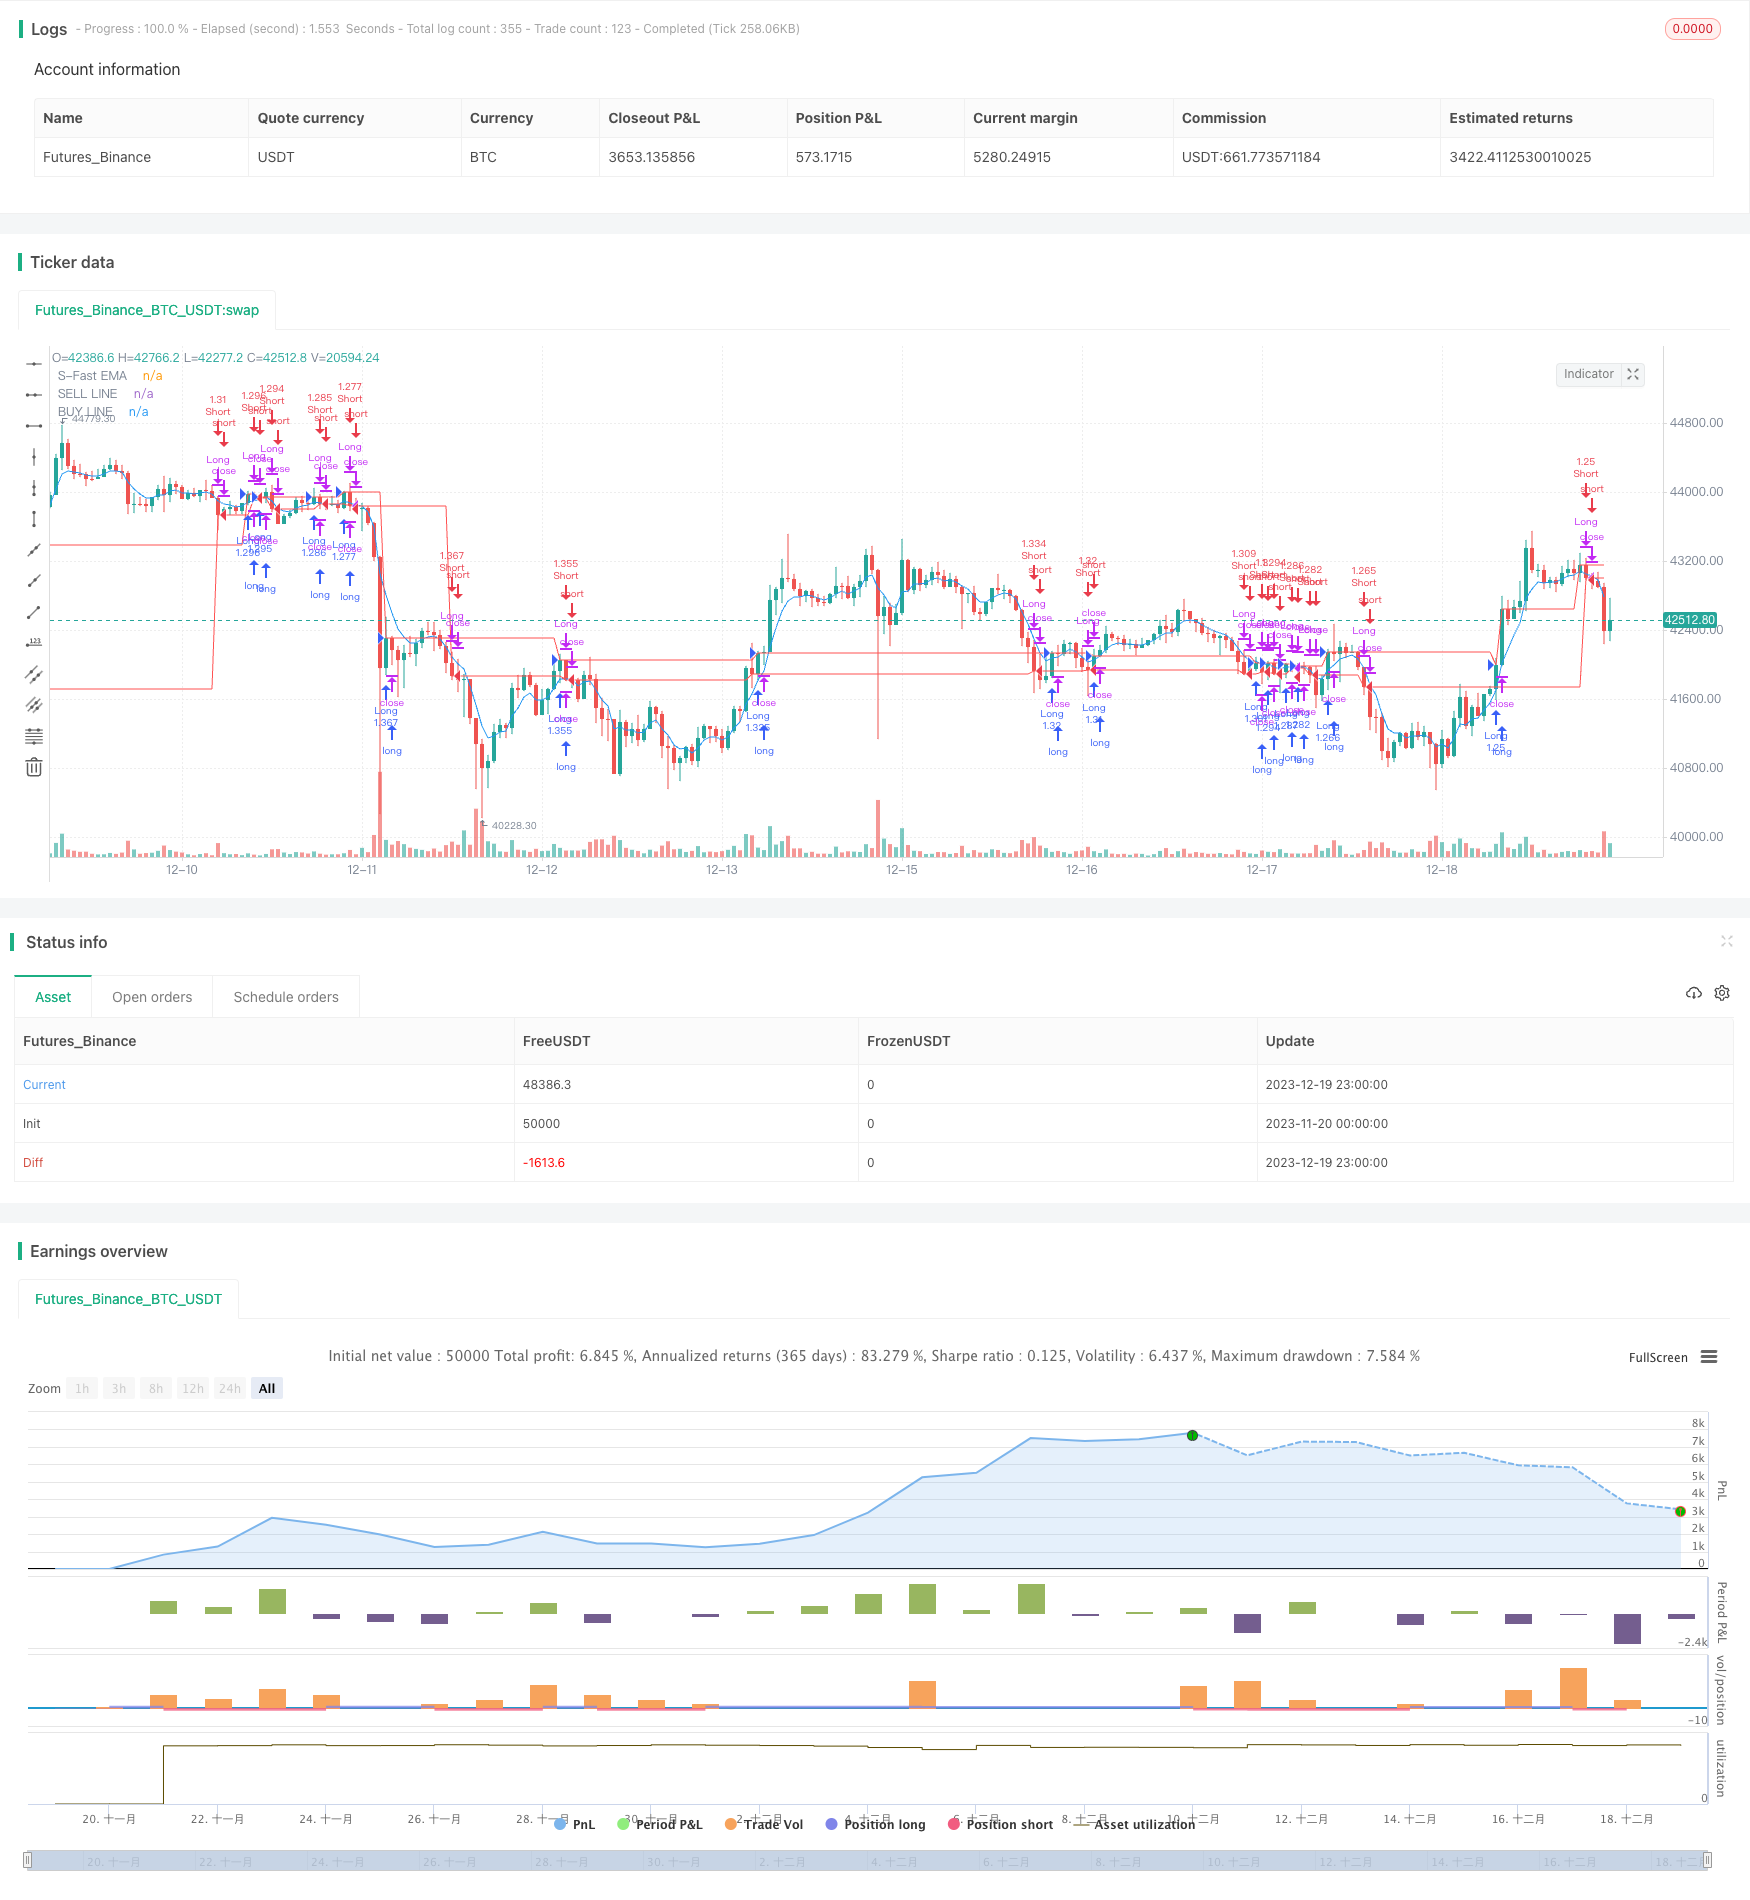
概述
三龙系统是一个结合延伸价格量趋势指标、唐奇安通道指标和抛物线SAR指标的复合技术交易策略。该策略利用三种指标的互补优势识别市场趋势方向和潜在买卖信号。
策略原理
该策略首先利用延伸价格量趋势指标和唐奇安通道判断市场趋势方向。当延伸价格量趋势指标位于基线之上且价格高于唐奇安通道上轨时,表示处于上升趋势;反之,延伸价格量趋势指标位于基线之下且价格低于唐奇安通道下轨时,表示处于下降趋势。
识别市场趋势方向后,该策略引入抛物线SAR指标识别具体的买入和卖出时机。当抛物线SAR指标下穿价格时,产生买入信号;当抛物线SAR指标上穿价格时,产生卖出信号。
为进一步验证信号,该策略还会在多个时间周期内确认趋势方向,避免在市场剧烈波动期间进入场内。此外,该策略还设置了多重止盈水平,以锁定利润并控制风险。
优势分析
三龙系统最大的优势在于指标组合使用互补性强的三种不同类型指标,可以更全面准确判断市场走势。具体来说,主要优势有:
- 延伸价格量趋势指标可以准确识别趋势变化点和趋势力度,基本面好;
- 唐奇安通道指标可以清晰判断趋势方向,较好抓住趋势;
- 抛物线SAR结合趋势指标使用,可以更准确找出买卖点位。
通过指标有机结合,可以充分发挥各指标优势,使三龙系统对大中长线走势判断准确,对买卖点识别更加精准,从而可以获取较优风险收益比。
风险分析
三龙系统作为一个指标组合策略,整体风险可控,但仍有一定风险需要注意:
- 延伸价格量趋势指标对假突破和巨量反转情况下判断失误风险;
- 在震荡盘整理过程中,唐奇安通道可能收窄,产生错误信号的概率较大;
- 抛物线SAR参数设置不当也会对买卖点识别产生一定影响。
针对以上风险,我们建议适当调整指标参数设置,并辅助参考其他指标判断,降低单一指标失效的概率。此外,合理止损和位置管理也对策略整体风险控制至关重要。
策略优化
三龙系统仍有进一步优化的空间:
- 可以引入机器学习算法自动优化指标参数;
- 可考虑引入波动率指标辅助判断,提高策略稳定性;
- 可以结合情绪指标判断公众情绪波动对策略的影响。
通过算法化参数优化、多指标组合判断和行为量化分析,有望进一步提升三龙系统的收益率和稳定性。我们将持续关注行业前沿技术,不断优化改进策略系统。
总结
三龙系统是一种技术指标组合策略,通过延伸价格量趋势指标、唐奇安通道指标和抛物线SAR指标三者优势互补判断市场走势和找出买卖点。该策略判断精准,风险可控,经多重验证,是一种适合中长线投资者的有效策略系统。我们将持续优化三龙系统,以期获得更优风险收益比。
/*backtest
start: 2023-11-20 00:00:00
end: 2023-12-20 00:00:00
period: 1h
basePeriod: 15m
exchanges: [{"eid":"Futures_Binance","currency":"BTC_USDT"}]
*/

//@version=5
strategy(title="TRIPLE DRAGON SYSTEM", overlay=true,default_qty_type = strategy.percent_of_equity,default_qty_value=100,initial_capital=1000,pyramiding=0,commission_value=0.01)
/////////////// DRAG-ON ///// EMA'S ///////////////
emar = ta.ema(close,5)
plot(emar, color=color.blue, title="S-Fast EMA")
//EMAlengthTRF = input.int(200, minval=1,title = "EMA Filter")
//ematrf = ta.ema(close,EMAlengthTRF)
//plot(ematrf, "EMA-TREND FILTER", color=color.red,linewidth = 4)
/////////////// 1-DRAG-ON /////EXTENDED PRICE VOLUME TREND ///////////////
lenght = input(200,"EPVT - Trend Lenght")
var cumVol = 0.
cumVol += nz(volume)
if barstate.islast and cumVol == 0
    runtime.error("No volume is provided by the data vendor.")
src = close

vt = ta.cum(ta.change(src)/src[1]*volume)
upx = ta.highest(vt,lenght)
downx = ta.lowest(vt,lenght)
basex = (upx +downx)/2
VTX = vt - basex

/////////////// 2-DRAG-ON ///// DON TREND ///////////////

length = input.int(200, minval=1, title = "Donchian Lenght")
lower = ta.lowest(length)
upper = ta.highest(length)
basis = math.avg(upper, lower)

updiff = upper - close
downdiff = lower - close
dontrend = -(updiff + downdiff)

xupx = ta.highest(dontrend,length) >0 ? ta.highest(dontrend,length) : 0

xdownx = ta.lowest(dontrend,length) < 0 ?ta.lowest(dontrend,length) :0
xxbasisxx = math.avg(xdownx, xupx)

inversedragup = xupx[1]
inversedragdown = xdownx[1]
inversedragon = (inversedragup+inversedragdown)/2

/////////////// 3-DRAG-ON ///// SUPER SAR-X ///////////////
start = input(0.02)
increment = input(0.02)
maximum = input(0.8)
entry_bars = input(1, title='Entry on Nth trend bar')

atr = ta.atr(14)

atr := na(atr) ? ta.tr : atr

psar = 0.0  // PSAR
af = 0.0  // Acceleration Factor
trend_dir = 0  // Current direction of PSAR
ep = 0.0  // Extreme point
trend_bars = 0

sar_long_to_short = trend_dir[1] == 1 and close <= psar[1]  // PSAR switches from long to short
sar_short_to_long = trend_dir[1] == -1 and close >= psar[1]  // PSAR switches from short to long

trend_change = barstate.isfirst[1] or sar_long_to_short or sar_short_to_long

// Calculate trend direction
trend_dir := barstate.isfirst[1] and close[1] > open[1] ? 1 : barstate.isfirst[1] and close[1] <= open[1] ? -1 : sar_long_to_short ? -1 : sar_short_to_long ? 1 : nz(trend_dir[1])

trend_bars := sar_long_to_short ? -1 : sar_short_to_long ? 1 : trend_dir == 1 ? nz(trend_bars[1]) + 1 : trend_dir == -1 ? nz(trend_bars[1]) - 1 : nz(trend_bars[1])

// Calculate  Acceleration Factor
af := trend_change ? start : trend_dir == 1 and high > ep[1] or trend_dir == -1 and low < ep[1] ? math.min(maximum, af[1] + increment) : af[1]

// Calculate extreme point
ep := trend_change and trend_dir == 1 ? high : trend_change and trend_dir == -1 ? low : trend_dir == 1 ? math.max(ep[1], high) : math.min(ep[1], low)

// Calculate PSAR
psar := barstate.isfirst[1] and close[1] > open[1] ? low[1] : barstate.isfirst[1] and close[1] <= open[1] ? high[1] : trend_change ? ep[1] : trend_dir == 1 ? psar[1] + af * atr : psar[1] - af * atr

//////////////// MELODY ///////////////////
VTY = ta.valuewhen(ta.cross(VTX,0),close,0)
//plot(VTY, color=color.black, title="Extended-PVT")

//DONTRENDX = ta.valuewhen(ta.cross(dontrend,0),close,0)
//plot(DONTRENDX, color=color.red, title="DONCHIAN TREND")

SSARX = ta.valuewhen(ta.cross(psar,close),close,0)
//plot(SSARX, color=color.black, title="SSAR-X")

MAXDRAG = math.max(SSARX,VTY)
//plot(MAXDRAG, color=color.black, title="MAX DRAG")
MINDRAG = math.min(SSARX,VTY)
//plot(MINDRAG, color=color.black, title="MIN DRAG")
BASEDRAG = math.avg(MAXDRAG,MINDRAG)
//plot(BASEDRAG, color=color.red, title="BASE DRAG")


/////BUY AND SELL LOGIC ///////////
DRAGONBUY = (ta.crossover(close,MAXDRAG) or ta.crossover(close,MINDRAG) )
DRAGONBUYSTOP = (ta.crossunder(close,MAXDRAG) or ta.crossunder(close,MINDRAG))
DRAGONBUYPLOT = ta.valuewhen(DRAGONBUY==true,close,0)
plot(DRAGONBUYPLOT, color=color.red, title="BUY LINE")

DRAGONSELL = (ta.crossunder(close,MAXDRAG) or ta.crossunder(close,MINDRAG) )
DRAGONSELLSTOP = (ta.crossover(close,MAXDRAG) or ta.crossover(close,MINDRAG))
DRAGONSELLPLOT = ta.valuewhen(DRAGONSELL==true,close,0)
plot(DRAGONSELLPLOT, color=color.red, title="SELL LINE")

/////TAKE PROFIT LOGIC ///////////
tp1 = input.int(5, minval=1,title = "TP-1")
tp2 = input.int(10, minval=1,title = "TP-2")
tp3 = input.int(15, minval=1,title = "TP-3")

TPTAKA1B = DRAGONBUYPLOT*(1+tp1/100)
//plot(TPTAKA1B, "BUY-TP1", color=color.red,linewidth = 1)
TPTAKA2B = DRAGONBUYPLOT*(1+tp2/100)
//plot(TPTAKA2B, "BUY-TP2", color=color.red,linewidth = 1)
TPTAKA3B = DRAGONBUYPLOT*(1+tp3/100)
//plot(TPTAKA3B, "BUY-TP3", color=color.red,linewidth = 1)

TPTAKA1S = DRAGONSELLPLOT*(1-tp1/100)
//plot(TPTAKA1S, "SELL-TP1", color=color.red,linewidth = 1)
TPTAKA2S = DRAGONSELLPLOT*(1-tp2/100)
//plot(TPTAKA2S, "SELL-TP2", color=color.red,linewidth = 1)
TPTAKA3S = DRAGONSELLPLOT*(1-tp3/100)
//plot(TPTAKA3S, "SELL-TP3", color=color.red,linewidth = 1)


BUYTP = ta.crossunder(emar,TPTAKA1B) or ta.crossunder(emar,TPTAKA2B) or ta.crossunder(emar,TPTAKA3B)
SELLTP = ta.crossover(emar,TPTAKA1B) or ta.crossover(emar,TPTAKA2B) or ta.crossover(emar,TPTAKA3B)

/////STRATEGY ///////////
// Enter condition
longCondition = DRAGONBUY==true
if longCondition
    strategy.entry('Long', strategy.long, comment = "ENTER-LONG")

// Exit condition
strategy.close('Long', when=DRAGONBUYSTOP, comment = "EXIT-LONG")

// Enter condition
ShortCondition = DRAGONSELL
if ShortCondition
    strategy.entry('Short', strategy.short, comment = "ENTER-SHORT")

// Exit condition
strategy.close('Short', when=DRAGONSELLSTOP, comment = "EXIT-SHORT")
///// END OF STRATEGY ///////////