概述
本策略基于两个著名指标:MACD和相对强度(RS)。通过把它们结合在一起,我们得到强大的买入信号。事实上,该策略的特别之处在于,它从一个指标中派生出另一个指标。因此,我们构建一个MACD,其来源是RS的值。该策略只考虑买入信号,忽略卖出信号,因为它们大多是亏损的。还有一个资金管理方法,使我们能够重新投资部分利润,或者在出现重大亏损时减少订单规模。
策略原理
RS是一个测量动量与市场效率假设之间异常的指标。它被专业人士使用,是最稳健的指标之一。其思想是持有表现优于平均水平的资产,根据它们过去的表现。我们使用以下公式计算RS:
RS = 当前价格 / RS长度内最高价
因此,我们可以比较当前价格与在这个用户定义的时段内的最高价格。
MACD是最著名的指标之一,它测量两个指数移动平均线之间的距离:一个快速线和一个较慢的线。距离越宽表示动量越大,反之亦然。我们将绘制这个距离线的值,并称之为macd线。MACD使用一个低于前两个的第三条移动平均线。这最后一条移动平均线将在穿过macd线时发出信号。因此,它是使用macd线的值作为其来源构建的。
需要注意的是,前两个移动平均线是使用RS值作为其来源构建的。所以,我们刚刚从一个指标中构建了另一个指标。这种方法非常强大,因为它很少被使用,为策略带来了价值。
优势分析
该策略结合了MACD和RS这两个单独就很强大的指标。MACD能够捕捉短期趋势和动量变化,而RS则反映了中长期趋势的坚实性。将它们结合使用,既考虑了短期因素,也考虑了长期因素,使买入信号更加可靠。
另外,该策略非常独特,通过从RS指标派生出MACD指标,创造性地提高了策略的效果。这种创新性设计很可能会带来超额收益,因为很少有人这么做。
最后,策略具有资金管理和止损机制,可以有效控制风险,限制个别交易的损失。
风险分析
该策略最大的风险在于RS和MACD指标发出错误信号的可能性。尽管这两个指标都很稳健,但任何技术指标都无法100%预测未来,信号可能偶尔会失效。此外,RS指标本身就更偏重于中长期趋势判断,短期内可能出现误导信号。
为减少风险,可以适当调整RS和MACD的参数,使其更符合具体交易品种和市场环境。另外也可以设置更严格的止损幅度。总的来说,利用止损来控制单笔损失是应对该策略风险的最佳方法。
优化方向
第一,可以测试不同市场(如股票、外汇、加密货币等)哪个品种该策略效果最好,然后专注最佳品种。
第二,可以尝试利用机器学习算法自动优化RS和MACD参数,而不是人工选择固定值。这可能大大提高参数的适应性。
第三,可以考虑增加其他指标参与建立交易信号,形成多因子模型,提高信号的准确性。比如加入成交量指标等。
总结
本策略综合运用MACD和RS两个指标提供强劲的买入信号。其创新之处在于,从RS指标派生出MACD指标,实现指标与指标的耦合,提高效果。该策略有明确的入场、止损和资金管理机制,能够有效控制风险。下一步,可以通过参数优化、改进信号Generation、增加其他因子等方法进一步完善该策略。
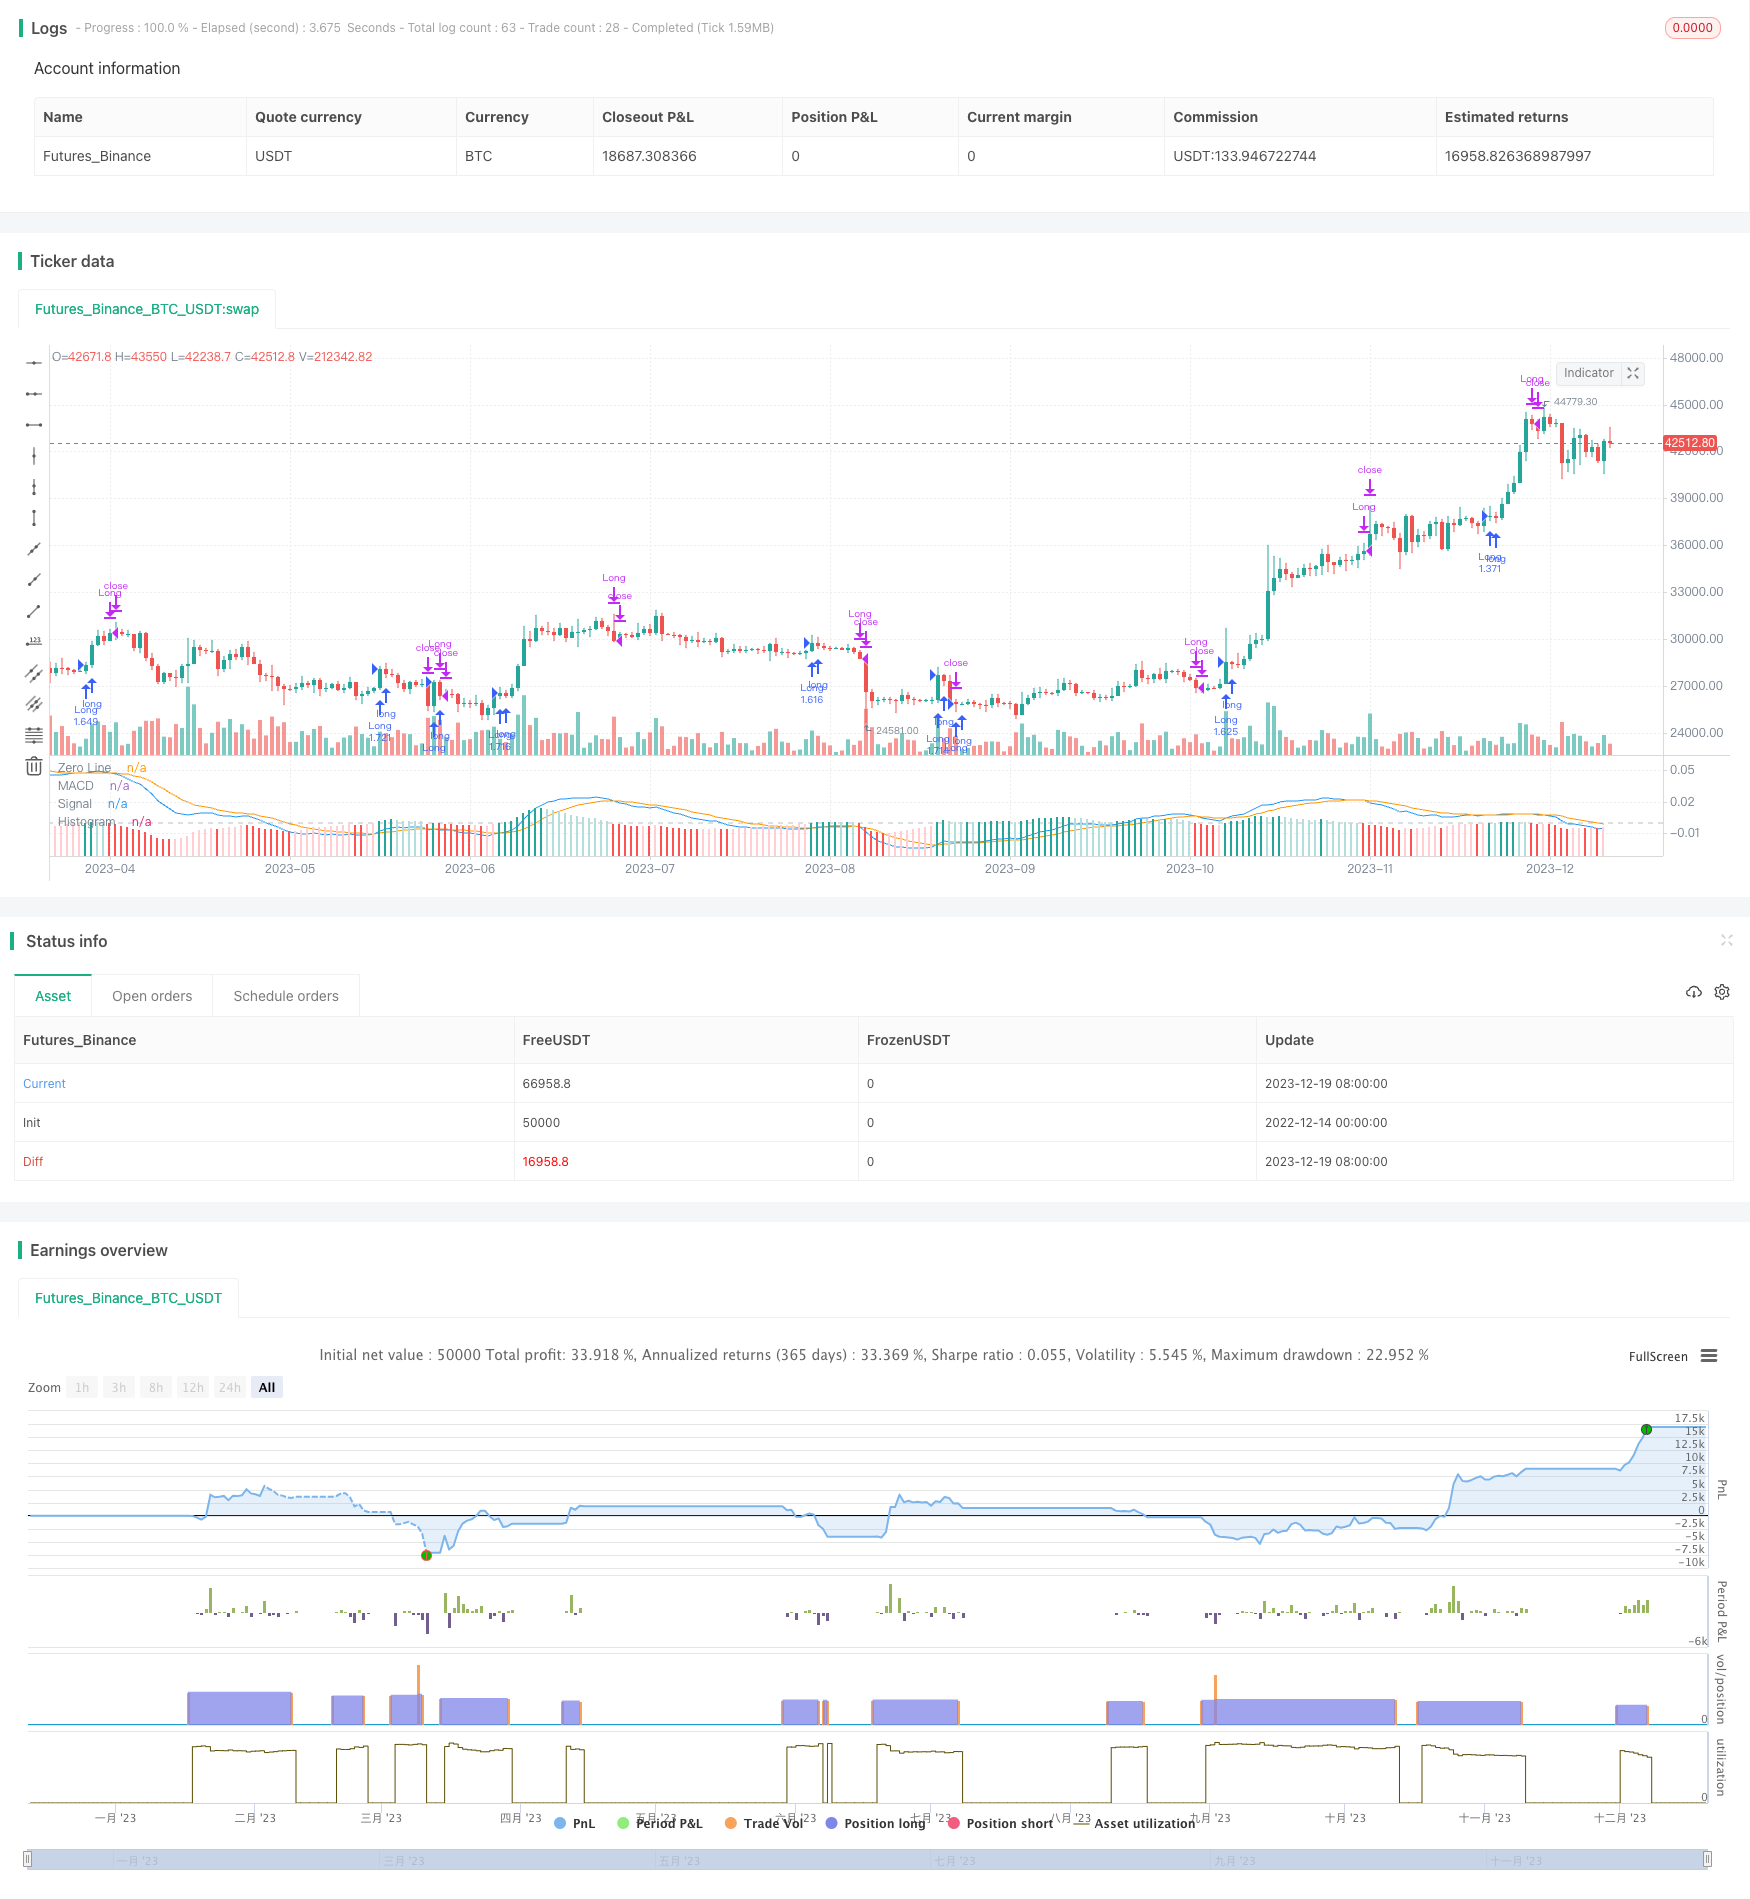
/*backtest
start: 2022-12-14 00:00:00
end: 2023-12-20 00:00:00
period: 1d
basePeriod: 1h
exchanges: [{"eid":"Futures_Binance","currency":"BTC_USDT"}]
*/

// This source code is subject to the terms of the Mozilla Public License 2.0 at https://mozilla.org/MPL/2.0/
// © gsanson66


//This strategy calculates the Relative Strength and plot the MACD of this Relative Strenght
//We take only buy signals send by MACD
//@version=5
strategy("MACD OF RELATIVE STRENGHT STRATEGY", shorttitle="MACD RS STRATEGY", precision=4, overlay=false, initial_capital=1000, default_qty_type=strategy.cash, default_qty_value=950, commission_type=strategy.commission.percent, commission_value=0.18, slippage=3)


//------------------------------TOOL TIPS--------------------------------//

t1 = "Relative Strength length i.e. number of candles back to find the highest high and compare the current price with this high."
t2 = "Relative Strength fast EMA length used to plot the MACD."
t3 = "Relative Strength slow EMA length used to plot the MACD."
t4 = "Macdline SMA length used to plot the MACD."
t5 = "The maximum loss a trade can incur (in percentage of the trade value)"
t6 = "Each gain or losse (relative to the previous reference) in an amount equal to this fixed ratio will change quantity of orders."
t7 = "The amount of money to be added to or subtracted from orders once the fixed ratio has been reached."


//----------------------------------------FUNCTIONS---------------------------------------//

//@function Displays text passed to `txt` when called.
debugLabel(txt, color, loc) =>
    label.new(bar_index, loc, text=txt, color=color, style=label.style_label_lower_right, textcolor=color.black, size=size.small)

//@function which looks if the close date of the current bar falls inside the date range
inBacktestPeriod(start, end) => (time >= start) and (time <= end)


//---------------------------------------USER INPUTS--------------------------------------//

//Technical parameters
rs_lenght = input.int(defval=300, minval=1, title="RS Length", group="Technical parameters", tooltip=t1)
fast_length = input(title="MACD Fast Length", defval=14, group="Technical parameters", tooltip=t2)
slow_length = input(title="MACD Slow Length", defval=26, group="Technical parameters", tooltip=t3)
signal_length = input.int(title="MACD Signal Smoothing",  minval=1, maxval=50, defval=10, group="Technical parameters", tooltip=t4)
//Risk Management
slMax = input.float(8, "Max risk per trade (in %)", minval=0, group="Risk Management", tooltip=t5)
//Money Management
fixedRatio = input.int(defval=400, minval=1, title="Fixed Ratio Value ($)", group="Money Management", tooltip=t6)
increasingOrderAmount = input.int(defval=200, minval=1, title="Increasing Order Amount ($)", group="Money Management", tooltip=t7)
//Backtesting period
startDate = input(title="Start Date", defval=timestamp("1 Jan 2020 00:00:00"), group="Backtesting Period")
endDate = input(title="End Date", defval=timestamp("1 July 2024 00:00:00"), group="Backtesting Period")


//----------------------------------VARIABLES INITIALISATION-----------------------------//
strategy.initial_capital = 50000
//Relative Strenght Calculation
rs = close/ta.highest(high, rs_lenght)
//MACD of RS Calculation
[macdLine, signalLine, histLine] = ta.macd(rs, fast_length, slow_length, signal_length)
//Money management
equity = math.abs(strategy.equity - strategy.openprofit)
var float capital_ref = strategy.initial_capital
var float cashOrder = strategy.initial_capital * 0.95
//Backtesting period
bool inRange = na


//------------------------------CHECKING SOME CONDITIONS ON EACH SCRIPT EXECUTION-------------------------------//

//Checking if the date belong to the range
inRange := true

//Checking performances of the strategy
if equity > capital_ref + fixedRatio
    spread = (equity - capital_ref)/fixedRatio
    nb_level = int(spread)
    increasingOrder = nb_level * increasingOrderAmount
    cashOrder := cashOrder + increasingOrder
    capital_ref := capital_ref + nb_level*fixedRatio
if equity < capital_ref - fixedRatio
    spread = (capital_ref - equity)/fixedRatio
    nb_level = int(spread)
    decreasingOrder = nb_level * increasingOrderAmount
    cashOrder := cashOrder - decreasingOrder
    capital_ref := capital_ref - nb_level*fixedRatio

//Checking if we close all trades in case where we exit the backtesting period
if strategy.position_size!=0 and not inRange
    strategy.close_all()
    debugLabel("END OF BACKTESTING PERIOD : we close the trade", color=color.rgb(116, 116, 116), loc=macdLine)


//-----------------------------------EXIT SIGNAL------------------------------//

if strategy.position_size>0 and histLine<0
    strategy.close("Long")


//-------------------------------BUY CONDITION-------------------------------------//

if histLine>0 and not (strategy.position_size>0) and inRange
    qty = cashOrder/close
    stopLoss = close*(1-slMax/100)
    strategy.entry("Long", strategy.long, qty)
    strategy.exit("Exit Long", "Long", stop=stopLoss)


//---------------------------------PLOTTING ELEMENT----------------------------------//

hline(0, "Zero Line", color=color.new(#787B86, 50))
plot(macdLine, title="MACD", color=color.blue)
plot(signalLine, title="Signal", color=color.orange)
plot(histLine, title="Histogram", style=plot.style_columns, color=(histLine>=0 ? (histLine[1] < histLine ? #26A69A : #B2DFDB) : (histLine[1] < histLine ? #FFCDD2 : #FF5252)))
plotchar(rs, "Relative Strenght", "", location.top, color=color.yellow)