概述
最后K线策略是一种趋势跟踪策略,它通过分析最后一根K线的收盘价和开盘价的关系来判断市场趋势方向,从而产生交易信号。
策略原理
该策略的核心逻辑是:
- 计算最后一根K线的开盘价和收盘价
- 如果开盘价低于收盘价,判断为上涨趋势,产生买入信号
- 如果开盘价高于收盘价,判断为下跌趋势,产生卖出信号
- 根据产生的交易信号,开仓做多或做空
- 设置止损和止盈价格,退出策略
具体来说,策略中通过请求最后一根K线的开盘价和收盘价数据,根据价格比较结果判断趋势方向。如果是上涨趋势,则在该K线收盘时以市价单开多单;如果是下跌趋势,则在该K线收盘时以市价单开空单。
之后设置止损和止盈价格。多单的止损价格为该K线的开盘价乘以一个系数,止盈价格为当前收盘价。空单则相反。当价格触发止损或止盈时,对应的仓位会被平仓退出。
优势分析
- 策略逻辑简单清晰,容易理解和实现
- 利用最后一个K线判断趋势,CAPTURE了最近的价格变化趋势
- 既有止损又有止盈,可以限制下行风险
风险分析
- 最后一个K线可能存在回调或震荡,增加 whipsaw 的概率
- 仅仅依据最后一个K线判断趋势可能会被套,应该结合趋势指标判断
- 回测数据不充分可能导致过拟合
可以通过结合趋势指标确认,优化止损止盈逻辑,扩大回测周期和市场环境来降低风险。
优化方向
- 可以结合MA, MACD等指标过滤入场时机
- 可以根据ATR来设置止损幅度
- 可以引入机器学习模型判断趋势方向
- 可以优化止损止盈策略,如移动止损、分批止盈等
总结
最后K线策略是一种简单的趋势跟踪策略。它通过最后一个K线快速判断趋势方向并交易。策略逻辑简单,易于实现,符合趋势跟踪的思路。同时设置有止损和止盈来控制风险。但仅仅依靠最后一个K线容易被套,应该与趋势指标结合使用。此外,此策略可扩展空间还很大,可以引入更多技术指标或机器学习模型以提高表现。
策略源码
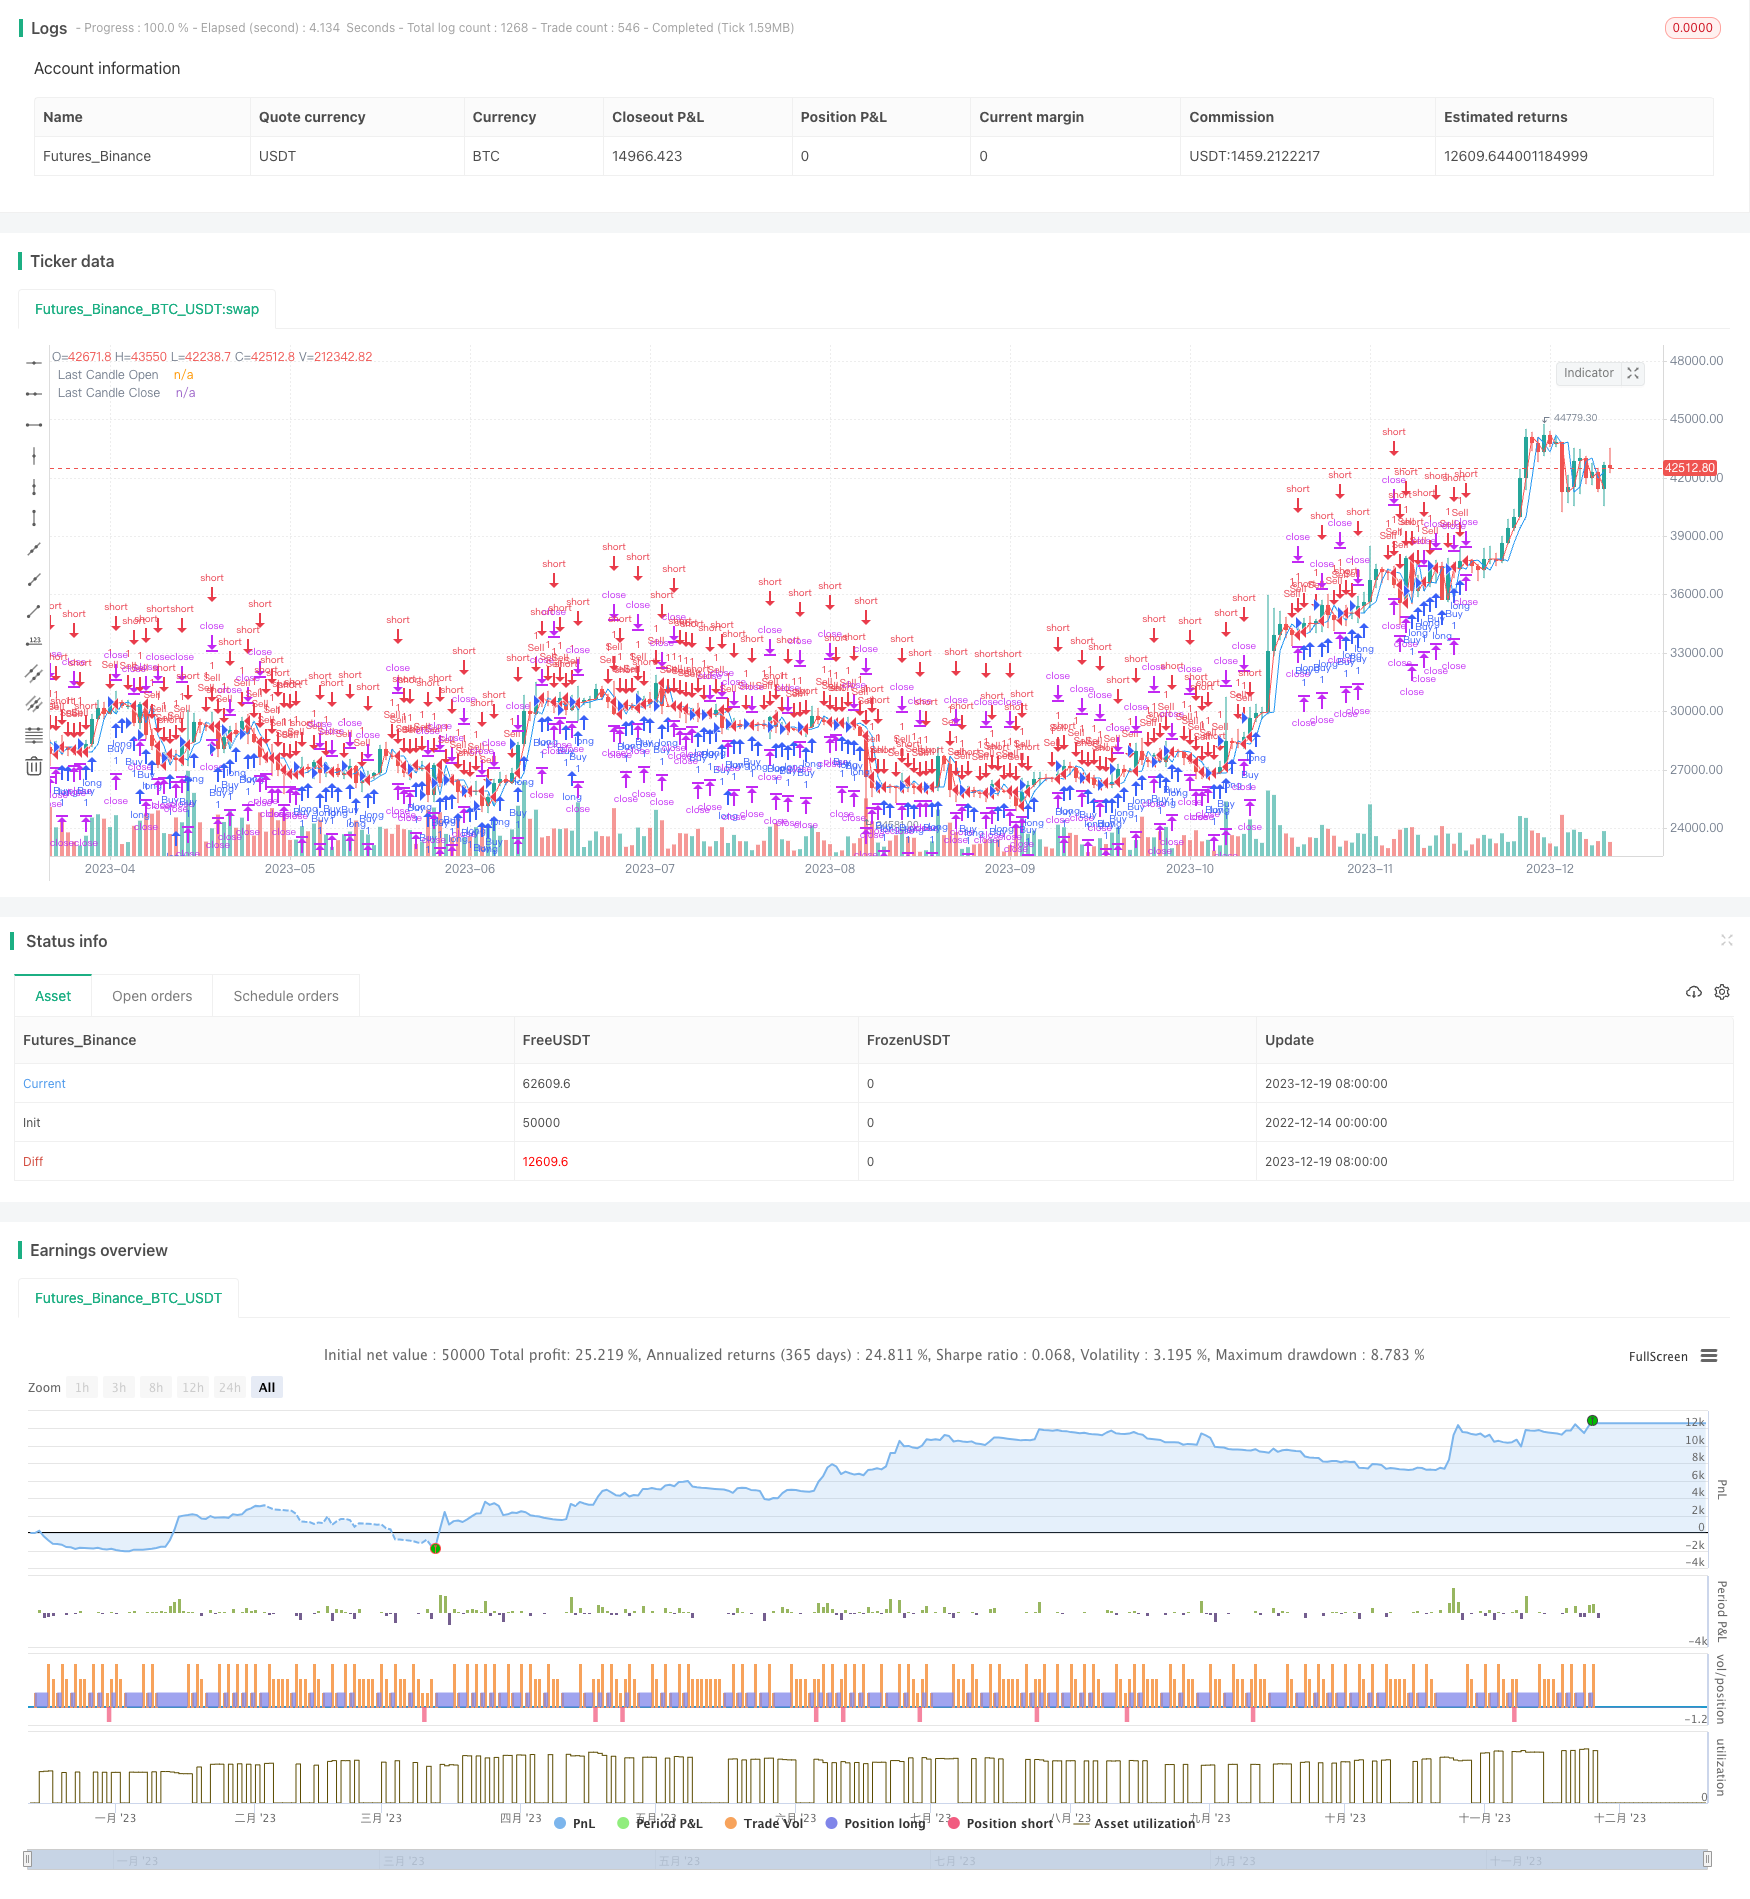
/*backtest
start: 2022-12-14 00:00:00
end: 2023-12-20 00:00:00
period: 1d
basePeriod: 1h
exchanges: [{"eid":"Futures_Binance","currency":"BTC_USDT"}]
*/

//@version=5
strategy("Last Candle Strategy with Date Range", overlay=true)

// Define the start and end dates for the backtest
startDate = timestamp(2015, 01, 01, 00, 00)
endDate = timestamp(2023, 11, 24, 23, 59)

// Check if the current bar is within the specified date range
withinDateRange = time >= startDate and time <= endDate

// If outside the date range, skip the strategy logic
if (not withinDateRange)
    strategy.close_all()

// Calculate the opening and closing values for the last candle
lastCandleOpen = request.security(syminfo.tickerid, "D", open[1], lookahead=barmerge.lookahead_on)
lastCandleClose = request.security(syminfo.tickerid, "D", close[1], lookahead=barmerge.lookahead_on)

// Determine the trade direction based on the last candle
tradeDirection = lastCandleOpen < lastCandleClose ? 1 : -1  // 1 for buy, -1 for sell

// Plot the last candle's opening and closing values on the chart
plot(lastCandleOpen, color=color.blue, title="Last Candle Open")
plot(lastCandleClose, color=color.red, title="Last Candle Close")

// Execute strategy orders
if (withinDateRange)
    if (tradeDirection == 1)
        strategy.entry("Buy", strategy.long)

    if (tradeDirection == -1)
        strategy.entry("Sell", strategy.short)

// Set stop loss and take profit
stopLoss = 0.01 * lastCandleOpen
takeProfit = close

// Exit strategy
strategy.exit("StopLoss/Profit", from_entry="Buy", loss=stopLoss, profit=takeProfit)
strategy.exit("StopLoss/Profit", from_entry="Sell", loss=stopLoss, profit=takeProfit)