概述
该策略主要思路基于LazyBear的Squeeze Momentum指标,分析买入和卖出的时机。它通过分析动量的趋势转折点,定位高点和低点,作为卖出和买入的信号。由于这是一个做多策略,因此还考虑了50周期的指数移动平均线来识别上升趋势。如果蜡烛的收盘价高于50日指数移动平均线,且50日指数移动平均线处于上升趋势时,则执行买入信号。如果这些条件不满足,则忽略买入信号。
策略原理
该策略融合布林带指标和Keltner通道指标识别趋势和压力区间。具体来说,它计算20周期的布林带,以及20周期Keltner通道的上下轨。当布林带完全落入Keltner通道内时,被视为挤压信号。当布林带下轨线超过Keltner通道下轨且布林带上轨线低于Keltner通道上轨时识别为挤压区间。相反,当布林带下轨线低于Keltner通道下轨且布林带上轨线高于Keltner通道上轨则识别为非挤压区间。
此外,该策略还利用线性回归分析动量的变化趋势和斜率。它计算过去20周期价格减去典型价格的线性回归值。当线性回归值的斜率为正,视为上升趋势;当斜率为负,则为下降趋势。在挤压区间内时,如果动量斜率发生反转,即视为买入和卖出信号。具体来说,当挤压区间内,动量由正转负时,产生卖出信号;而当挤压区间内,动量由负转正时,产生买入信号。
为过滤假信号,该策略还会判断收盘价是否高于50日指数移动平均线,以及50日指数移动平均线是否处于上升。只有这两个条件同时满足时,买入信号才会被执行。
策略优势分析
这是一个非常聪明的策略,同时利用两种不同类型指标对市场进行多维度判断,可以有效避免假信号。具体来说,它的优势有:
综合运用布林带、Keltner通道和动量指标,进行多维度分析,提高判断准确性。
挤压区间可以有效识别动量反转的高低点,精确捕捉转折。
基于收盘价和50日指数移动平均线进行趋势过滤,可以避免在盘整中重复开仓。
只在挤压区间发出信号,可以减少假信号,提高盈利概率。
该策略参数优化空间大,可通过调整周期等参数进行针对性优化。
长短兼顾,既考虑了大周期趋势,又结合了中短期指标,做多方向明确。
风险分析
尽管该策略 Nonfarming 了多项技术指标判断,但仍存在一定风险:
布林带和Keltner通道发散时,会错过买入/卖出时机。
行情暴涨暴跌时,会给策略带来较大亏损。
高波动行情中,挤压情况可能不明显,信号较少。
牛熊转换时,容易形成调整亏损。
针对这些风险,我们可以通过以下方法加以规避:
优化参数,使布林带和Keltner通道尽量同步。
设置止损线,控制单笔损失。
采用本策略作为组合策略的一部分,与其他策略搭配使用。
在高波动行情中,适当降低仓位。
优化方向
该策略还有很大的优化空间,主要优化方向有:
优化布林带和Keltner通道的长度周期,使它们尽可能同步。
测试不同的倍数因子,寻找最佳参数组合。
尝试加入其他指标进行确认,如RSI等。
基于文华五彩线等模型判断市场阶段,有选择性地使用该策略。
采用机器学习等方法动态优化参数。
回测不同币种,寻找最适合的交易品种。
探索该策略在更长周期(日线、周线等)的效果。
总结
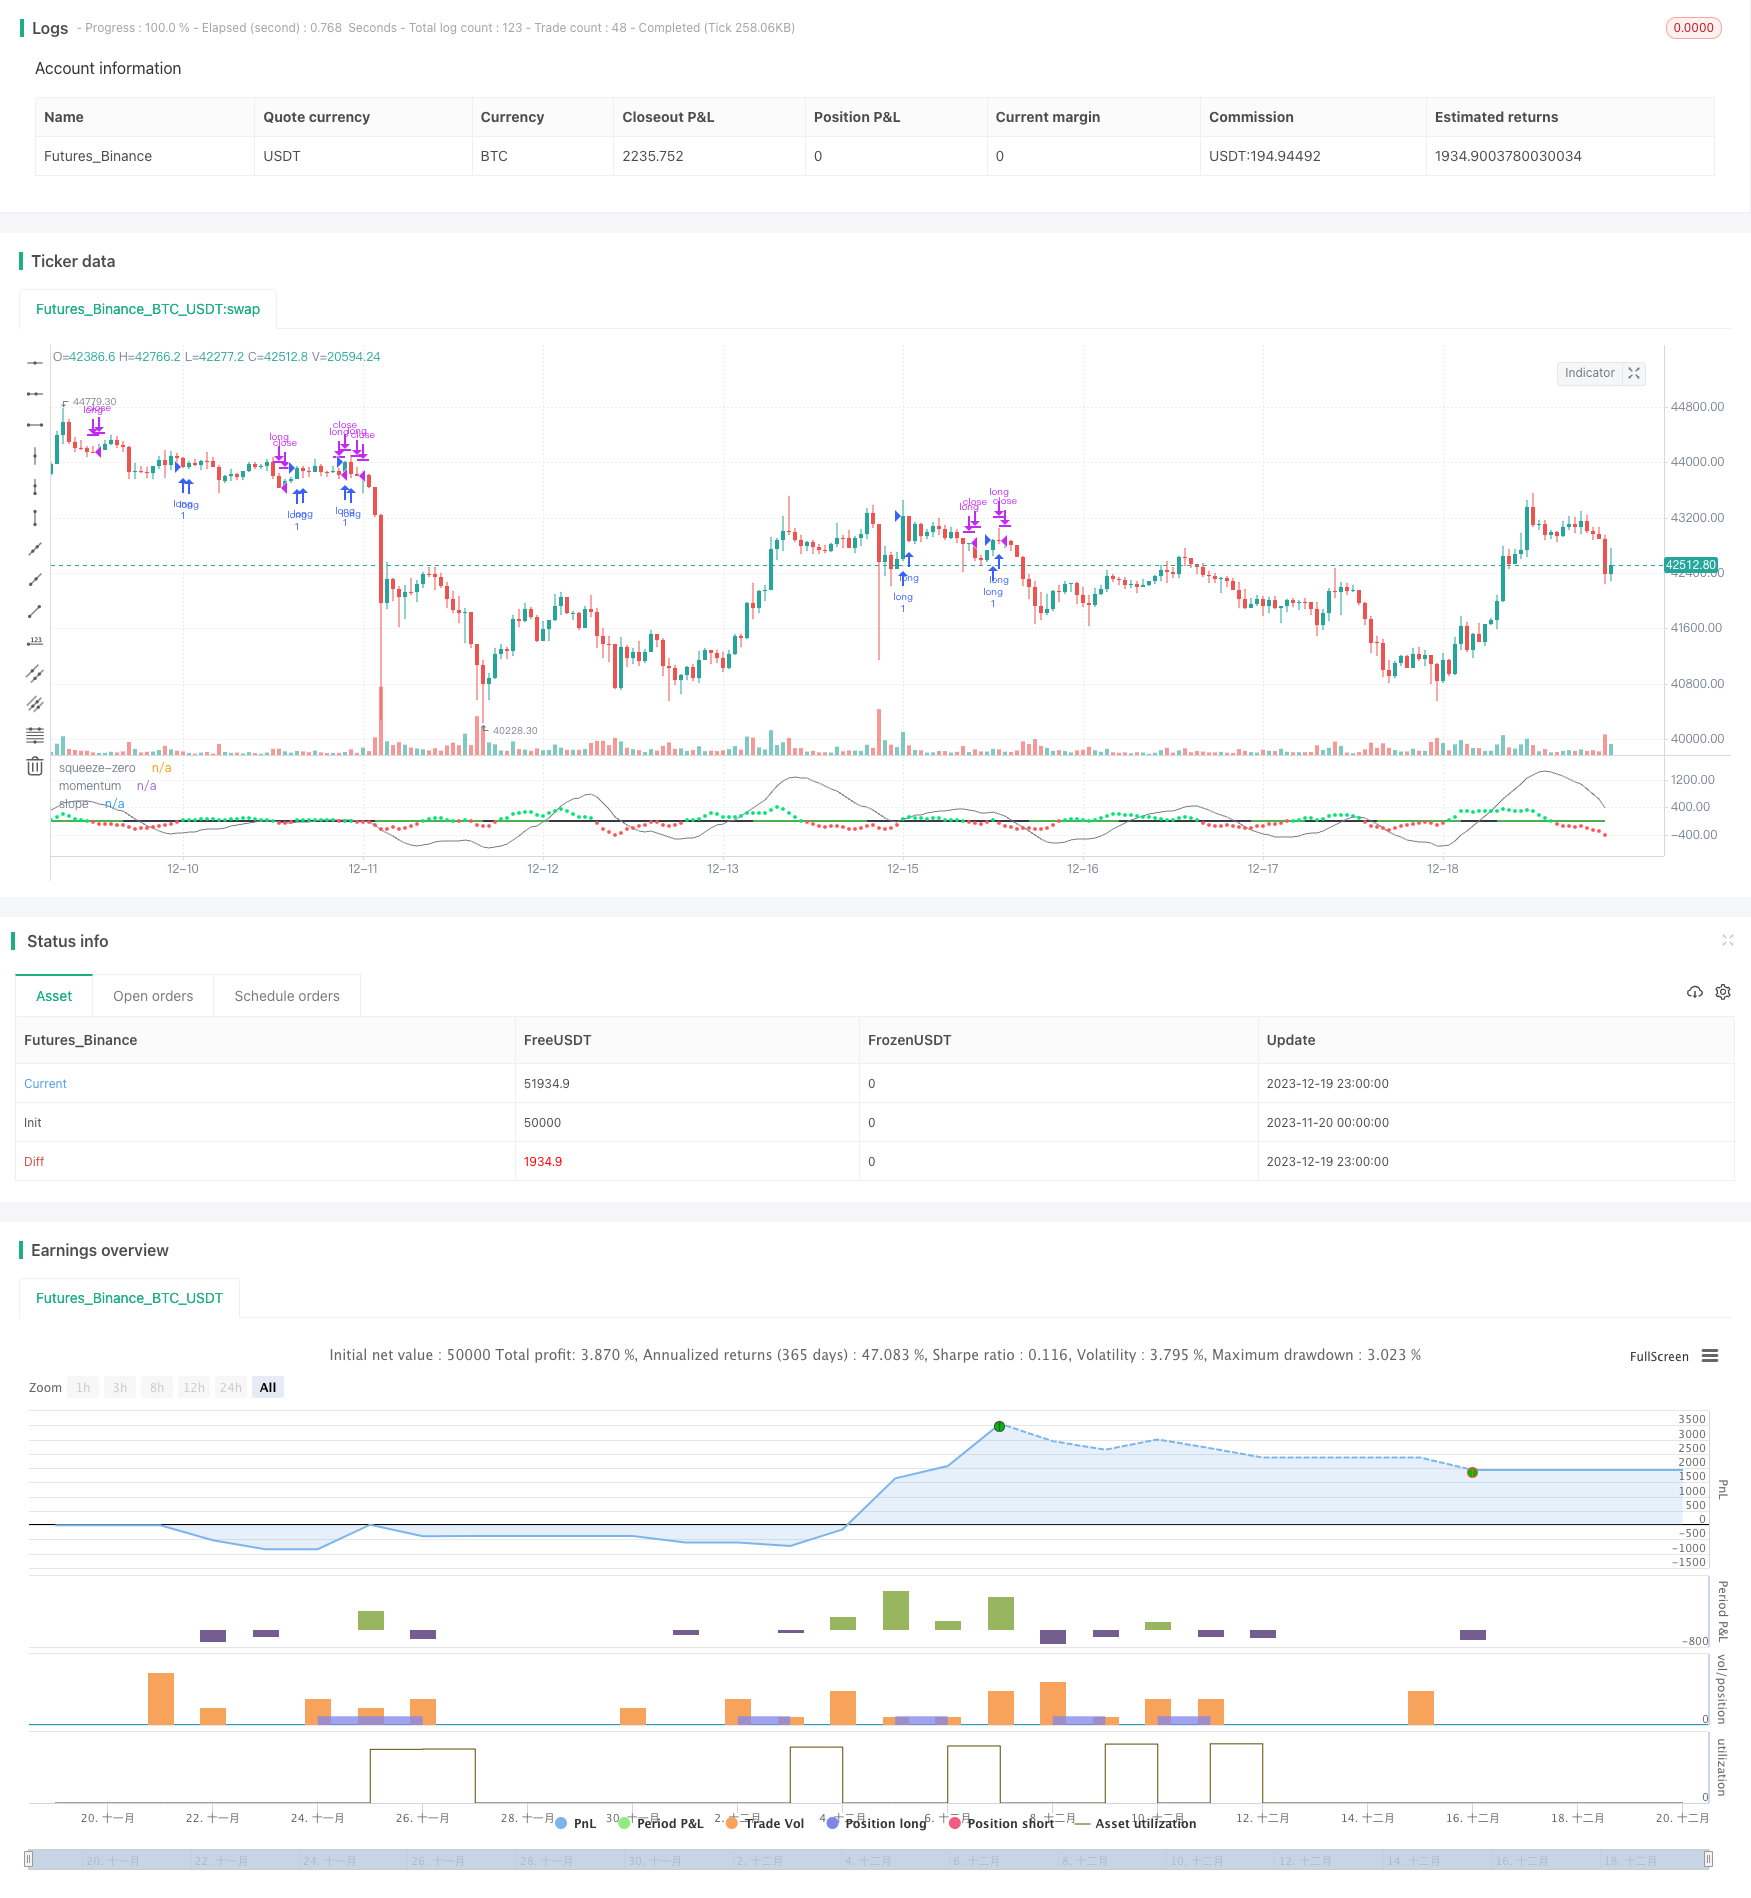
LazyBear压力矩量化动量策略综合运用多种技术指标,在挤压区间精确识别动量转折进行交易,避免在非趋势行情中频繁开仓。它系统性地定义了量化买卖规则,在回测中表现优异。通过优化参数设置、引入新的判断指标等手段,该策略还具有很大的改进空间,值得量化交易者深入研究和应用。
/*backtest
start: 2023-11-20 00:00:00
end: 2023-12-20 00:00:00
period: 1h
basePeriod: 15m
exchanges: [{"eid":"Futures_Binance","currency":"BTC_USDT"}]
*/

//@version=4

//
// @author LazyBear
// List of all my indicators: https://www.tradingview.com/v/4IneGo8h/
//
initialBalance = 8000

strategy("Crypto momentum strategy", overlay=false)


length = input(20, title="BB Length")
mult = input(2.0, title="BB MultFactor")
lengthKC = input(20, title="KC Length")
multKC = input(1.5, title="KC MultFactor")

useTrueRange = input(true, title="Use TrueRange (KC)", type=input.bool)

// Calculate BB
source = close
basis = sma(source, length)
ema = ema(source, 50)
dev = multKC * stdev(source, length)
upperBB = basis + dev
lowerBB = basis - dev

// Calculate KC
ma = sma(source, lengthKC)
range = useTrueRange ? tr : high - low
rangema = sma(range, lengthKC)
upperKC = ma + rangema * multKC
lowerKC = ma - rangema * multKC

sqzOn = lowerBB > lowerKC and upperBB < upperKC
sqzOff = lowerBB < lowerKC and upperBB > upperKC
noSqz = sqzOn == false and sqzOff == false

val = linreg(source - avg(avg(highest(high, lengthKC), lowest(low, lengthKC)), sma(close, lengthKC)), lengthKC, 0)

slope = (val - val[2])
emaSlope = (ema - ema[1])


bcolor = iff(slope > 0, color.lime, color.red)
scolor = noSqz ? color.green : sqzOn ? color.black : color.green
squeeze = (noSqz ? 0 : sqzOn ? 1 : 0)

plot(val, color=color.gray, style=plot.style_line, linewidth=1, title="momentum")
plot(slope, color=bcolor, style=plot.style_circles, linewidth=2, title="slope")
plot(0, color=scolor, style=plot.style_line, linewidth=2, title="squeeze-zero")

co = crossover(slope / abs(slope), 0)
cu = crossunder(slope / abs(slope), 0)

if co and source > ema and emaSlope > 0
    strategy.entry("long", strategy.long, comment="long")
if cu
    strategy.close("long")