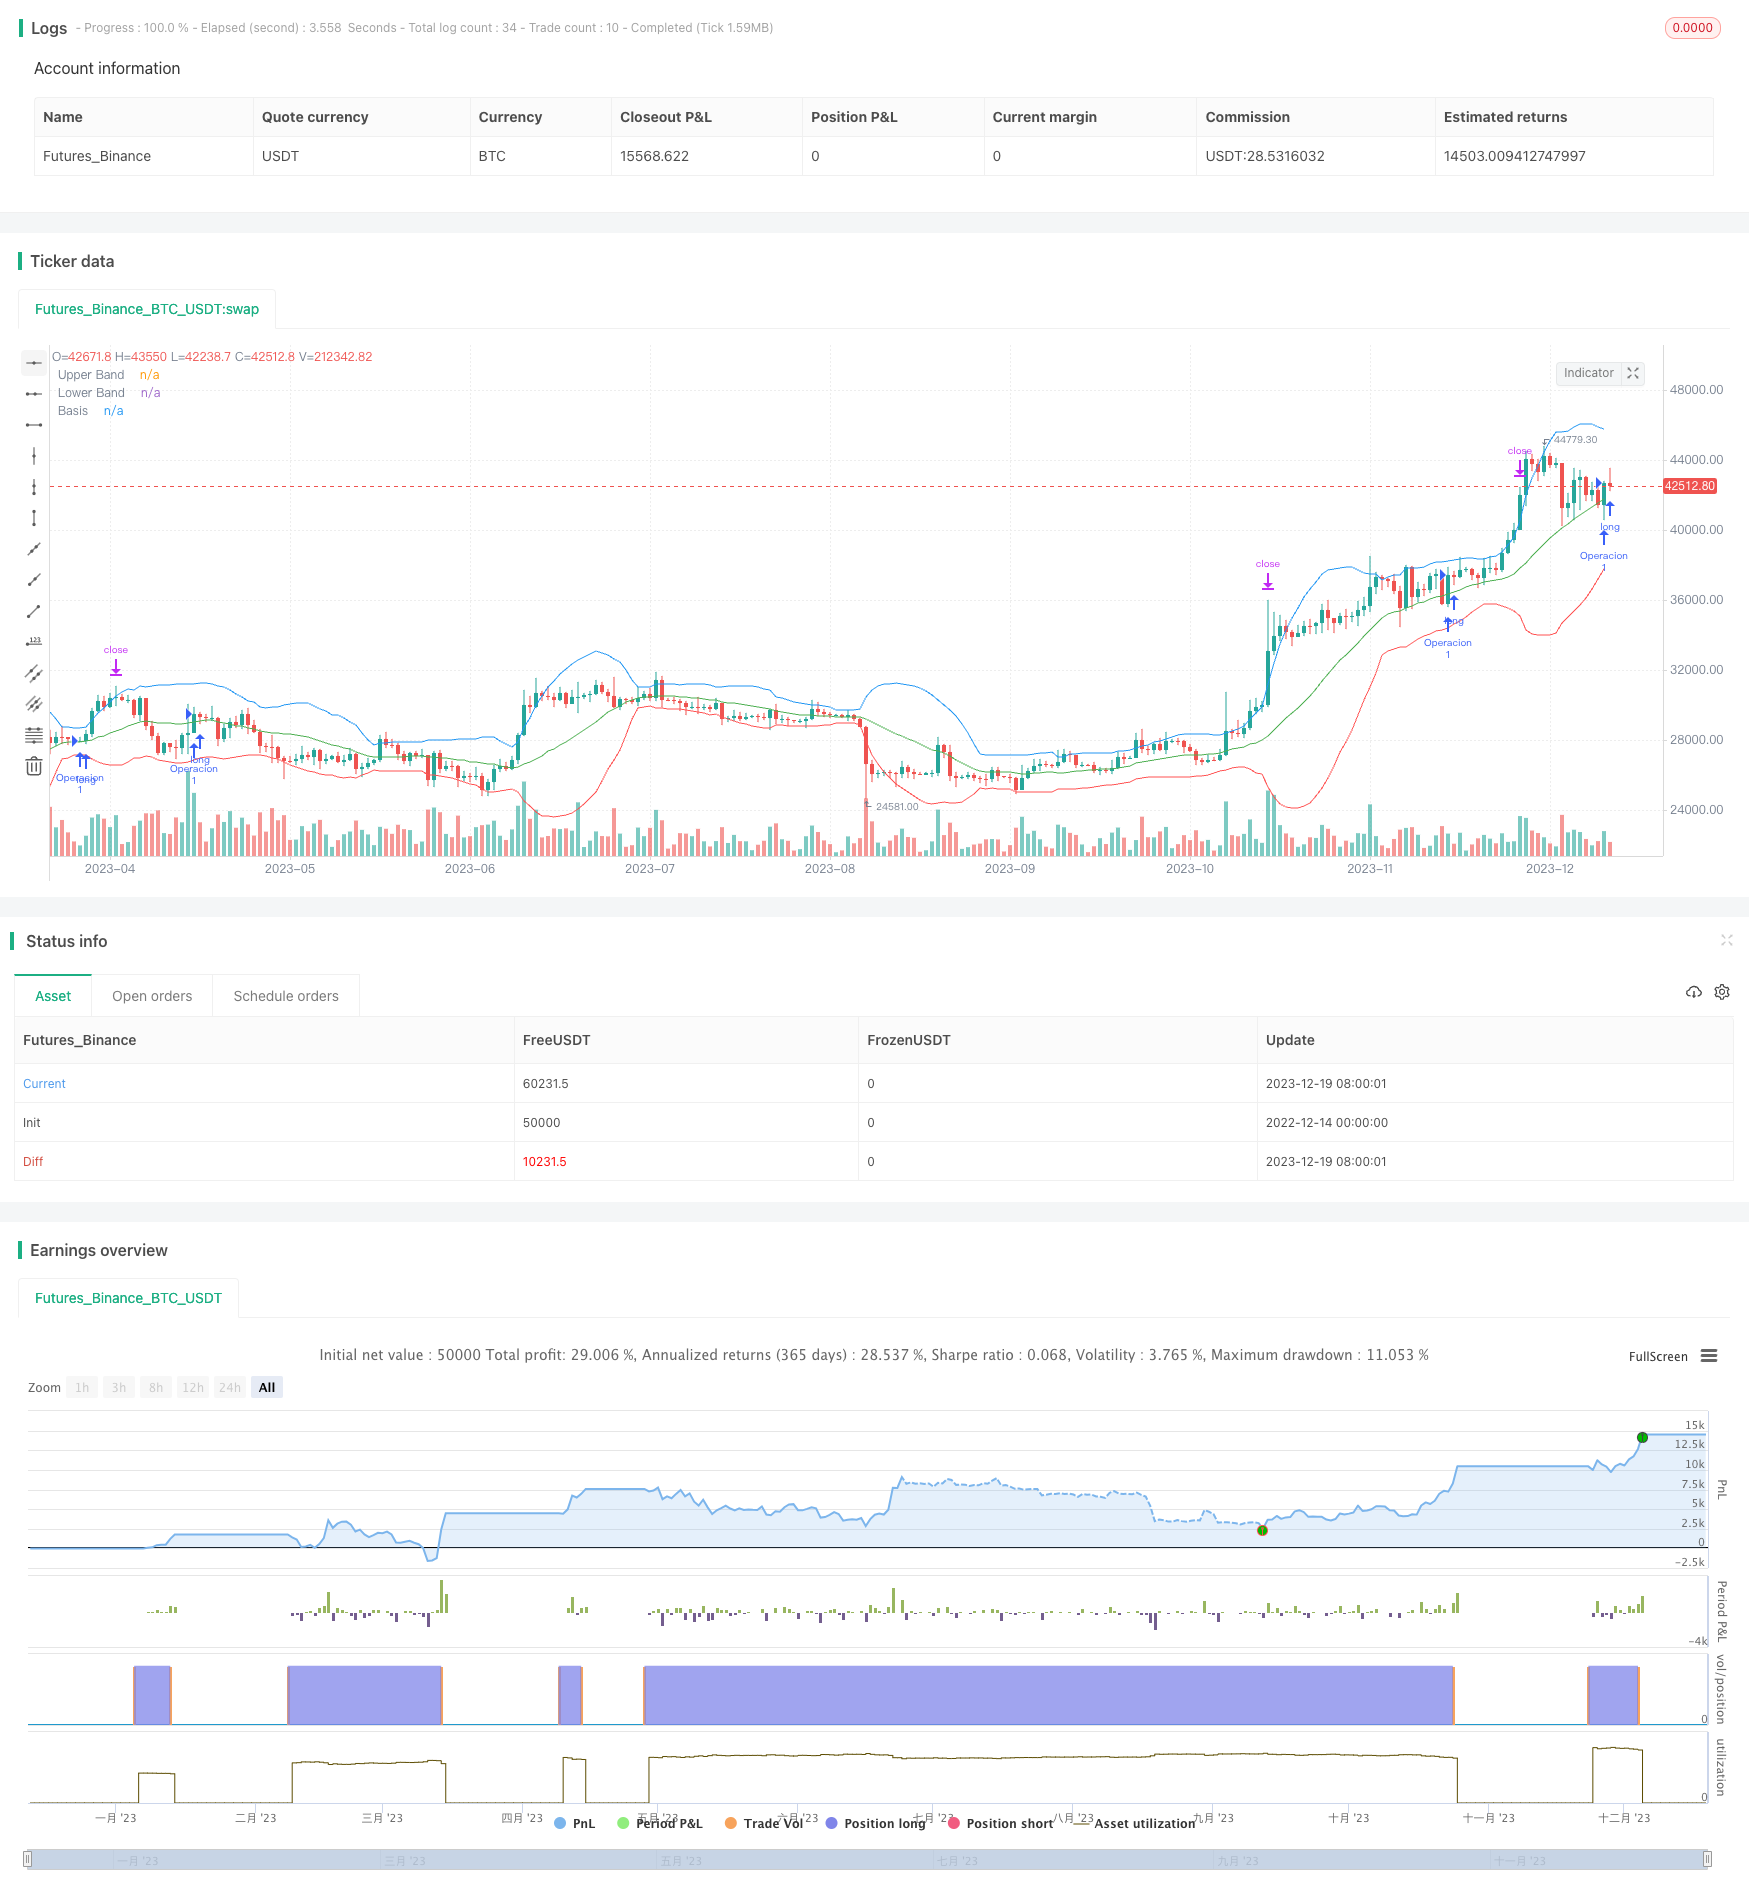
概述
本策略基于布林带指标实现了一个高频交易策略。该策略通过计算价格的标准差和移动平均线,来确定上下布林带。当价格触及中线时,进行买入或卖出操作。每次交易固定投入全部资金,并设置0.5%的止盈范围。该策略适用于高波动性交易对和无手续费的交易所。
策略原理
该策略使用布林带指标判断价格是否到达过度买入或卖出的状态。布林带由上布林带、下布林带和中线组成。中线是价格的n日简单移动平均线。上布林带是中线加上k倍的n日价格标准差。下布林带是中线减去k倍的n日价格标准差。k值一般设置为2。当价格接近上布林带时代表过度买入,当价格接近下布林带时代表过度卖出。
本策略设置布林带参数长度为20天,k值为2。当价格触及中线时,判断为价格从过度区域回归,产生交易信号。做多信号为价格上穿中线,做空信号为价格下穿中线。
每次开仓时,投入全部资金(包括本金和浮动盈亏)。然后设置0.5%的止盈范围。当价格移动超过0.5%时,平仓套利。
优势分析
该策略具有如下优势:
使用布林带指标判断买卖点,相比简单移动平均线等指标,布林带更能判断价格的相对高低点。
采用高频交易策略,每个交易周期很短,可以迅速获利。
每次交易投入全部资金,可以最大化获利。
设置止盈范围来锁定利润,可以有效控制风险。
风险分析
该策略也存在一些风险:
布林带指标对参数很敏感,如果参数设置不当,会产生大量错误信号。
高频交易需要无手续费的交易所,否则手续费会迅速蚕食利润。
全部资金交易风险大。如果遇到突发事件,可能会造成较大亏损。
止盈范围过小,交易次数会很多,操作频繁。
对应解决方法:
对布林带参数进行优化,找到最佳参数。
选择无手续费的交易所,例如币安现货。
设置止损来控制最大损失。
适当扩大止盈范围,减少交易次数。
优化方向
该策略可以从以下方面进行优化:
结合交易量指标,例如能量潮指标,过滤假突破。
对布林带参数进行优化,找到最佳参数组合。
设置动态止盈止损范围。例如,随着交易次数或盈利次数的增加,逐步扩大止盈范围。
添加机器学习模型,利用模型预测判断买卖点。
结合基本面分析,在重要事件前后(如财报发布)避开交易。
总结
本策略基于布林带构建了一个高频交易策略。使用布林带判断买卖点,全仓交易,小止盈来实现高效盈利。同时也存在一些参数敏感性、风险控制等问题。我们可以从完善指标体系、动态止损、机器学习等多方面进行优化,使策略更稳定可靠。
/*backtest
start: 2022-12-14 00:00:00
end: 2023-12-20 00:00:00
period: 1d
basePeriod: 1h
exchanges: [{"eid":"Futures_Binance","currency":"BTC_USDT"}]
*/

//@version=5
strategy("Estrategia Bollinger Bands", shorttitle="BB Strategy", overlay=true)

// Parámetros de las Bandas de Bollinger
length = input(20, title="Longitud")
mult = input(2.0, title="Multiplicador")

// Calcula las Bandas de Bollinger
basis = ta.sma(close, length)
upper_band = basis + mult * ta.stdev(close, length)
lower_band = basis - mult * ta.stdev(close, length)

// Condiciones para realizar operaciones
price_touches_basis_up = ta.crossover(close, basis)
price_touches_basis_down = ta.crossunder(close, basis)

// Monto inicial de inversión
monto_inicial = 10

// Lógica de la estrategia
if (price_touches_basis_up)
    qty = strategy.equity + strategy.netprofit // Invertir el total del capital más las ganancias en cada operación
    direction = close > basis ? strategy.long : strategy.short
    strategy.entry("Operacion", direction, qty = 1)

// Lógica para cerrar la operación con un movimiento del 0.5% (take profit)
target_profit = 0.005 // Actualizado a 0.5%

if (strategy.position_size != 0)
    direction = strategy.position_size > 0 ? strategy.long : strategy.short
    strategy.exit("Take Profit/Close", from_entry = "Operacion", profit = close * (1 + target_profit))

// Dibuja las Bandas de Bollinger en el gráfico
plot(upper_band, color=color.blue, title="Upper Band")
plot(lower_band, color=color.red, title="Lower Band")
plot(basis, color=color.green, title="Basis")

// Muestra el monto inicial de inversión en la barra del título
var label lbl = label.new(na, na, "")
label.set_text(lbl, "Monto Inicial: $" + str.tostring(monto_inicial, "#.########"))
label.set_xy(lbl, bar_index, low)
label.set_color(lbl, color.new(color.blue, 0))