Type/to search

MACD Golden Cross Death Cross Trend Following Strategy

Common strategy
Created: 2023-12-22 11:45:54
Last modified: 3 years ago
1
Follow
1802
Followers

img

Overview

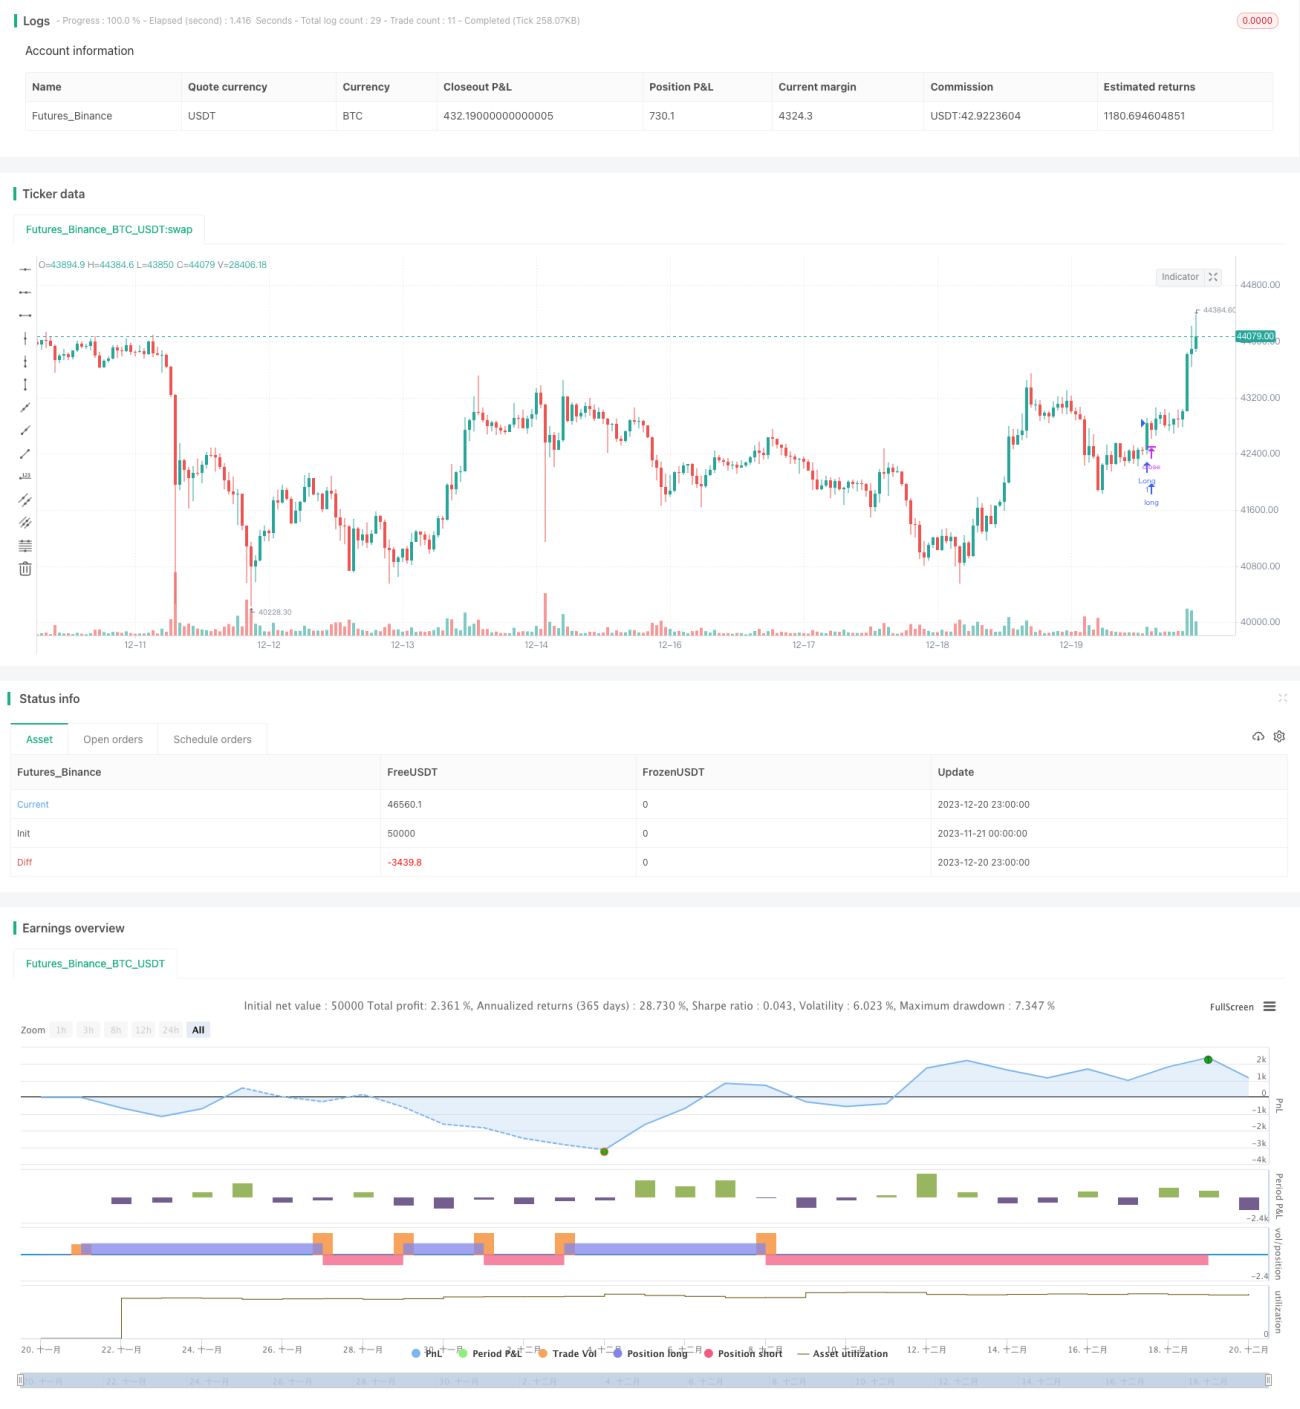
This strategy uses the golden cross and death cross of the MACD indicator to determine the trend direction, and uses the ATR indicator for stop loss and take profit to implement trend following trading. The strategy name highlights the use of the golden cross and death cross signals of the MACD indicator.

Strategy Logic

When the MACD line crosses above the Signal line from below and becomes positive, a buy signal is generated, which is called the golden cross signal, indicating an upward trend in the stock price. When the MACD line crosses below the Signal line from above and becomes negative, a sell signal is generated, which is called the death cross signal, indicating a downward trend in the stock price.

The strategy simply goes long on golden crosses and goes short on death crosses to follow trends. At the same time, the strategy also introduces the ATR indicator to calculate stop loss and take profit levels to construct the trading system.

Specifically, the strategy first calculates the fast moving average, slow moving average, MACD difference, Signal line and other standard MACD indicators. Then, based on the chosen one of five signal types (continuation signal, reversal signal, histogram signal, MACD zero cross, Signal line zero cross), golden crosses and death crosses are determined. Finally, stop loss and take profit are set based on the ATR indicator to complete the entry and exit logic.

Advantage Analysis

The strategy has the following advantages:

  1. Using the MACD indicator to determine the trend direction is accurate and reliable. The MACD indicator has performed prominently in trend determination over the years.

  2. The stop loss and take profit settings based on the ATR indicator can effectively control the risk-reward ratio of single trades and reduce the probability of losses.

  3. Providing five optional signal types allows using the most appropriate signal for different markets, improving the adaptability of the strategy.

  4. There are many tunable input parameters that can be optimized for better trading performance.

Risks and Solutions

There are also some risks with this strategy:

  1. The MACD indicator can easily generate false signals and cause unnecessary losses. Other indicators can be used to filter the signals.

  2. The ATR indicator only models the fluctuations of the recent period and cannot accurately stop loss in extreme market conditions. Dynamic stops can be introduced to solve this issue.

  3. The performance of chosen signals may not be stable. Extensive backtesting is required to determine the optimal parameters.

  4. The signal parameters and risk management parameters need to be optimized together, otherwise it’s hard to find the globally optimal results. Stepwise optimization methods are recommended.

Optimization Suggestions

The strategy can also be optimized in the following aspects:

  1. Try other moving averages like TMA, Hull MA etc to filter MACD signals.

  2. Try dynamic stop mechanisms that can better deal with fluctuations in extreme market conditions.

  3. Exhaustively optimize traditional MACD parameters to find better combinations.

  4. Use machine learning methods to find optimal ATR multiples for better risk management.

  5. Backtest each of the five signal types separately to determine the optimal signal.

  6. Train neural networks to judge signal quality and discover new signals based on MACD.

Conclusion

The MACD golden cross death cross trend following strategy utilizes the MACD indicator to determine trend direction and sets stop loss and take profit with the ATR indicator, which can effectively capture trend trading opportunities. The strategy has multiple advantages like tunable parameters, complete stop mechanisms and optional signal types. The next step is to improve signal quality, stop loss mechanisms and parameter selection optimization in order to obtain better backtest and live results.

Source
Pine
/*backtest
start: 2023-11-21 00:00:00
end: 2023-12-21 00:00:00
period: 1h
basePeriod: 15m
exchanges: [{"eid":"Futures_Binance","currency":"BTC_USDT"}]
*/

// This source code is subject to the terms of the Mozilla Public License 2.0 at https://mozilla.org/MPL/2.0/
// © vuagnouxb

//@version=4
Strategy parameters
Strategy parameters
Fast Length
Slow Length
Source
Signal Smoothing
Simple MA(Oscillator)
Simple MA(Signal Line)
Choose your signal
JPY Pair ?
How many years of testing ?
Comment
All comments (0)
No data
No data
  • 1
Forums
PINE Language
Get the app
iPhone Download
© 2015 - ∞ INVENTOR PTE LTD (SG)