概述
该策略是一个基于简单移动平均线(SMA)、指数移动平均线(EMA)、Keltner通道、MACD指标、随机指标(Stochastic)的短线量化交易策略。它根据价格是否突破SMA和EMA的方式,结合Keltner通道、MACD指标、Stochastic指标的多空信号,实现自动化的交易入场和出场。
策略原理
该策略使用25周期的SMA、200周期的EMA构建双移动平均线指标。当价格从下向上突破双移动平均线时产生买入信号;当价格从上向下突破双移动平均线时,产生卖出信号。
同时,该策略使用10周期构建Keltner通道,价格突破通道上轨和下轨也会作为辅助信号。MACD指标通过快线、慢线和MACD柱形图产生买卖信号。Stochastic指标通过%K线和%D线的金叉死叉也组成多空信号。
具体来说,当收盘价高于SMA和EMA,且处于Keltner通道内部,MACD柱形图为负值,Stochastic%K值低于50时,产生买入信号,做多;当收盘价低于SMA和EMA,且处于Keltner通道内部,MACD柱形图为正值,Stochastic%K值高于50时,产生卖出信号,做空。
策略优势
- 使用双移动平均线结合通道指标,能有效过滤市场假突破。
- 综合多种技术指标信号,能够提高信号的可靠性。
- 多空信号规则清晰,程序化执行效率高。
- 适用于短线频繁交易的量化策略。
策略风险及优化
- 作为短线交易策略,存在一定的交易频率过高风险。
- 没有止损机制,存在较大亏损风险。
- 可考虑加入波动率指标,优化开仓及止损条件。
- 可测试不同周期参数的优劣,寻找最佳参数组合。
总结
该策略整合了移动平均线、通道指标、MACD指标和Stochastic指标四种常用技术指标。通过价格的突破与不突破来判断多空,属于典型的短线量化交易策略。相比单一指标,它综合运用多指标判断能提高信号准确性,值得进一步测试优化。
策略源码
/*backtest
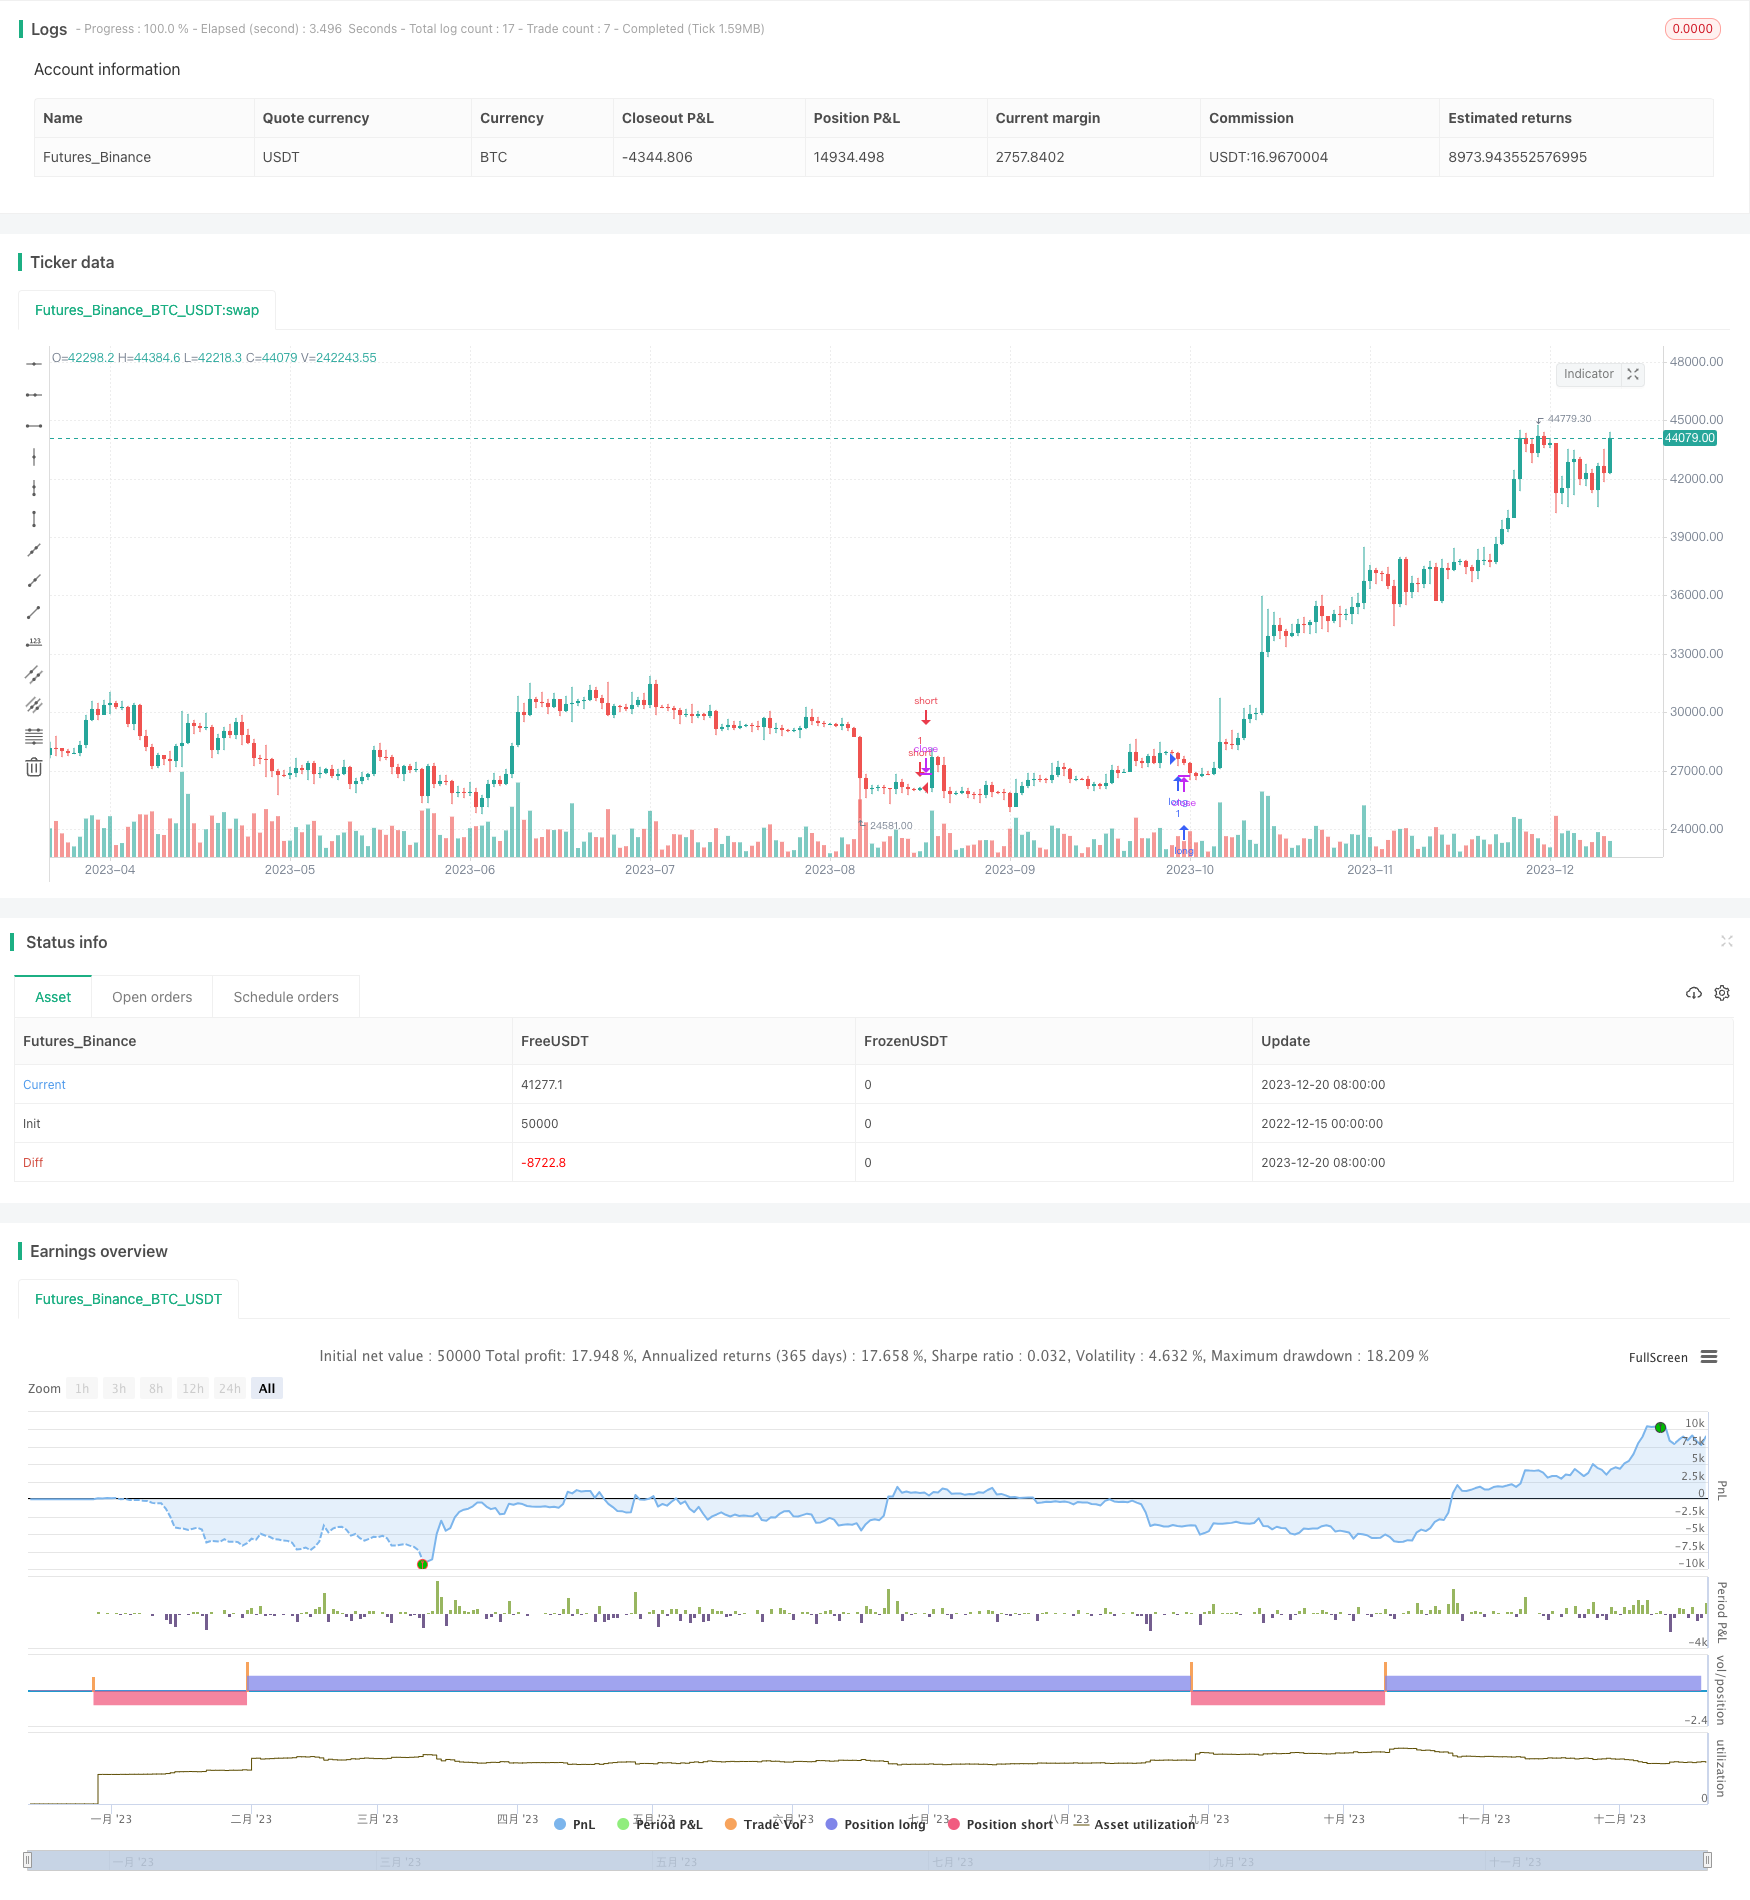
start: 2022-12-15 00:00:00
end: 2023-12-21 00:00:00
period: 1d
basePeriod: 1h
exchanges: [{"eid":"Futures_Binance","currency":"BTC_USDT"}]
*/
// This source code is subject to the terms of the Mozilla Public License 2.0 at https://mozilla.org/MPL/2.0/
// © exlux99
//@version=5
strategy(title="Scalping Trading System Crypto and Stocks", overlay=true)
src = input(low, title="Source")
//sma and ema
len = input.int(25, minval=1, title="Length SMA" , group="Moving Averages")
len2 = input.int(200, minval=1, title="Length EMA", group="Moving Averages")
out = ta.sma(src, len)
out2 = ta.ema(src, len2)
//keltner
lengthk = input.int(10, minval=1, title="Length Keltner Channel",group="Keltner")
mult = input(2.0, "Multiplier",group="Keltner")
BandsStyle = input.string("Average True Range", options = ["Average True Range", "True Range", "Range"], title="Bands Style",group="Keltner")
atrlength = input(14, "ATR Length",group="Keltner")
ma = ta.sma(src, lengthk)
rangema = BandsStyle == "True Range" ? ta.tr(true) : BandsStyle == "Average True Range" ? ta.atr(atrlength) : ta.rma(high - low, lengthk)
upper = ma + rangema * mult
lower = ma - rangema * mult
//stoch
periodK = input.int(10, title="%K Length", minval=1,group="Stochastic")
smoothK = input.int(1, title="%K Smoothing", minval=1,group="Stochastic")
periodD = input.int(1, title="%D Smoothing", minval=1,group="Stochastic")
k = ta.sma(ta.stoch(close, high, low, periodK), smoothK)
d = ta.sma(k, periodD)
//macd 1
fast_length = input(title="Fast Length MACD", defval=4,group="MACD Fast")
slow_length = input(title="Slow Length MACD", defval=34,group="MACD Fast")
signal_length = input.int(title="Signal Smoothing MACD", minval = 1, maxval = 50, defval = 5,group="MACD Fast")
sma_source = input.string(title="Oscillator MA Type MACD", defval="EMA", options=["SMA", "EMA"],group="MACD Fast")
sma_signal = input.string(title="Signal Line MA Type MACD", defval="EMA", options=["SMA", "EMA"],group="MACD Fast")
fast_ma = sma_source == "SMA" ? ta.sma(src, fast_length) : ta.ema(src, fast_length)
slow_ma = sma_source == "SMA" ? ta.sma(src, slow_length) : ta.ema(src, slow_length)
macd = fast_ma - slow_ma
signal = sma_signal == "SMA" ? ta.sma(macd, signal_length) : ta.ema(macd, signal_length)
hist = macd - signal
long= close > out and close < upper and close > lower and hist < 0 and k < 50 and close > out2
short= close < out and close < upper and close > lower and hist > 0 and k > 50 and close < out2
strategy.entry("long",strategy.long,when= long)
strategy.entry("short",strategy.short,when=short)