概述
该策略基于单均线和布林带指标,当价格突破布林带上轨或下轨时,进行买入或卖出操作。同时结合均线的方向判断趋势,只有在均线上升时才进行买入,在均线下降时才进行卖出。
策略原理
该策略主要根据以下几个指标进行判断:
- 均线(SMA):计算CLOSE收盘价的简单移动平均线,代表价格趋势。
- 布林带上轨:代表仰角阻力线,突破该线表示强势突破。
- 布林带下轨:代表支撑线,跌破该线表示趋势反转的可能。
具体交易信号如下:
- 买入信号:当收盘价突破布林带上轨,且均线处于上升状态,进行买入。
- 卖出信号:当收盘价跌破布林带下轨,且均线处于下降状态,进行卖出。
这样,结合趋势和突破,使交易信号更加可靠,避免假突破。
策略优势
- 规则简单清晰,容易理解执行。
- 利用均线判断大趋势方向,避免做空牛市,做多熊市。
- 布林带上下轨判断局部突破点位,精确捕获突破信号。
- 回撤相对较小,符合多数人的风险偏好。
策略风险
- 单一指标容易发出错误信号,可通过优化参数降低错误率。
- 无法应对大的行情震荡,可适当调整止损点位。
- 无法在趋势巨大的情况下获利更多,可考虑加大仓位。
策略优化
- 优化均线周期参数,适应更多品种。
- 增加其它指标过滤,如MACD等,减少错误信号。
- 动态调整止损点位,限制最大回撤。
- 结合资金管理思想,使盈亏更加平稳。
总结
该策略整体来说较为简单实用,适合多数人. 通过一些优化调整,可以使策略更加鲁棒,适应更多市场情况,是一个值得推荐的策略。
策略源码
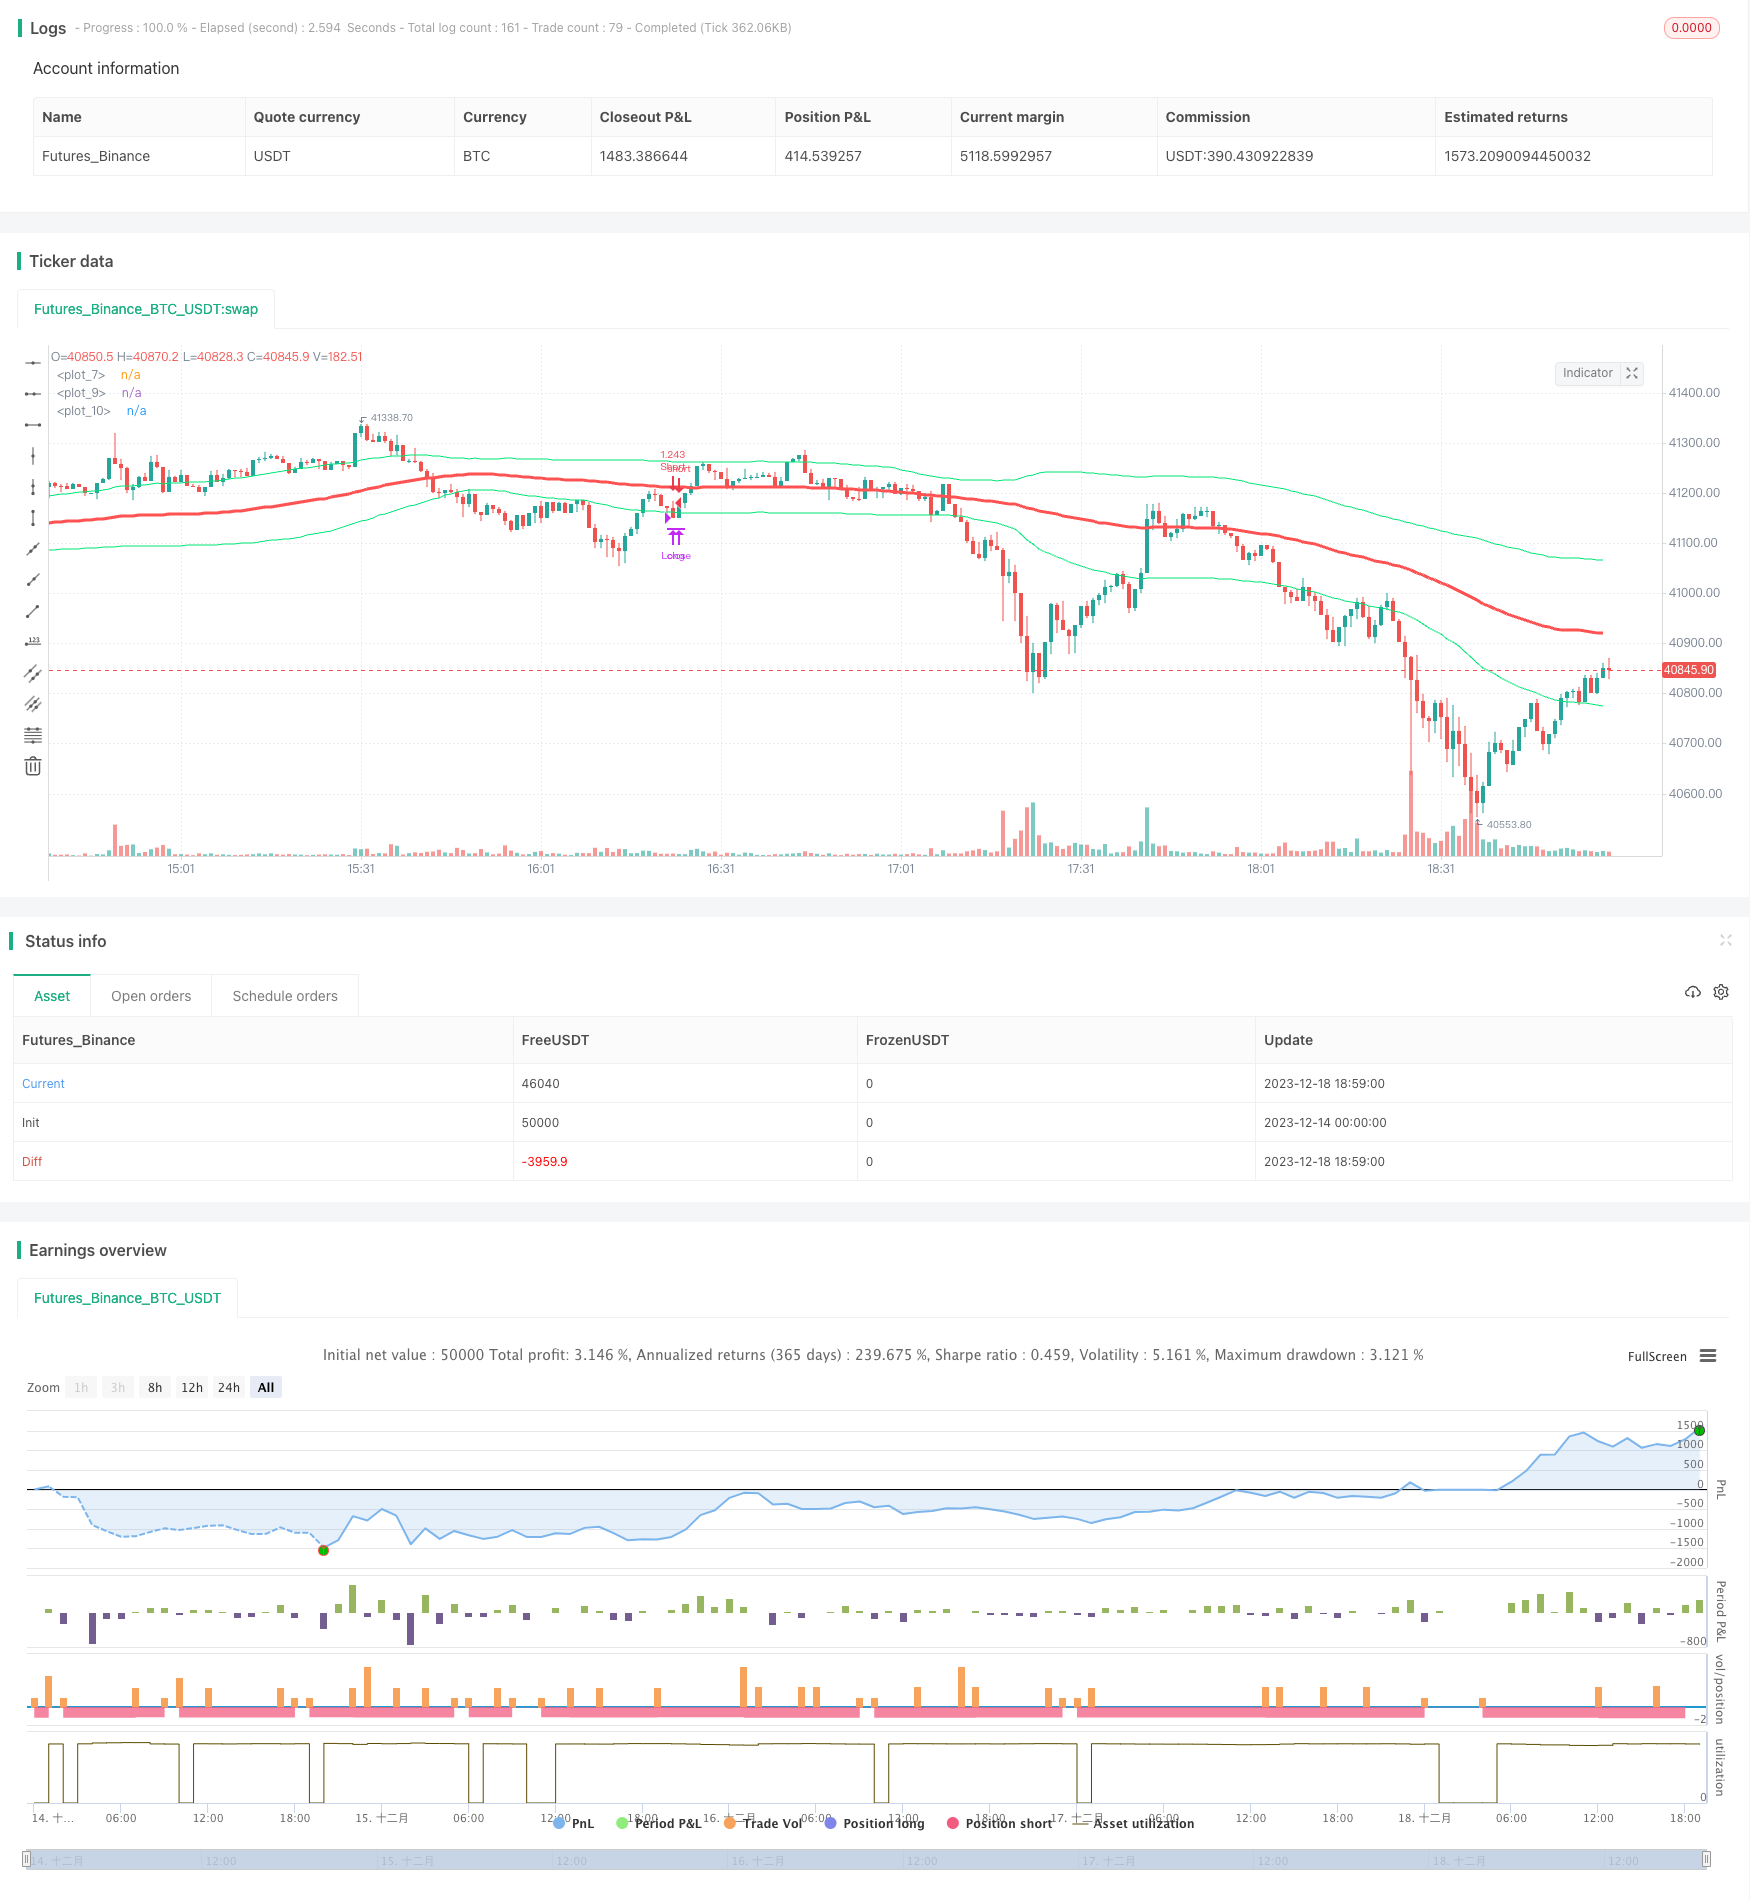
/*backtest
start: 2023-12-14 00:00:00
end: 2023-12-18 19:00:00
period: 1m
basePeriod: 1m
exchanges: [{"eid":"Futures_Binance","currency":"BTC_USDT"}]
*/

//@version=2
strategy(title="single sma cross", shorttitle="single sma cross",default_qty_type = strategy.percent_of_equity, default_qty_value = 100,overlay=true,currency="USD")
s=input(title="s",defval=90)
p=input(title="p",type=float,defval=.9,step=.1)

sa=sma(close,s)
plot(sa,color=red,linewidth=3)
band=stdev(close,s)*p
plot(band+sa,color=lime,title="")
plot(-band+sa,color=lime,title="")

// ===Strategy Orders============================================= ========
inpTakeProfit = input(defval = 0, title = "Take Profit", minval = 0)
inpStopLoss = input(defval = 0, title = "Stop Loss", minval = 0)
inpTrailStop = input(defval = 0, title = "Trailing Stop Loss", minval = 0)
inpTrailOffset = input(defval = 0, title = "Trailing Stop Loss Offset", minval = 0)
useTakeProfit = inpTakeProfit >= 1 ? inpTakeProfit : na
useStopLoss = inpStopLoss >= 1 ? inpStopLoss : na
useTrailStop = inpTrailStop >= 1 ? inpTrailStop : na
useTrailOffset = inpTrailOffset >= 1 ? inpTrailOffset : na

longCondition = crossover(close,sa+band) and rising(sa,5)
shortCondition = crossunder(close,sa-band) and falling(sa,5)
crossmid = cross(close,sa)


strategy.entry(id = "Long", long=true, when = longCondition)
strategy.close(id = "Long", when = shortCondition)
strategy.entry(id = "Short", long=false, when = shortCondition)
strategy.close(id = "Short", when = longCondition)
strategy.exit("Exit Long", from_entry = "Long", profit = useTakeProfit, loss = useStopLoss, trail_points = useTrailStop, trail_offset = useTrailOffset, when=crossmid)
strategy.exit("Exit Short", from_entry = "Short", profit = useTakeProfit, loss = useStopLoss, trail_points = useTrailStop, trail_offset = useTrailOffset, when=crossmid)