概述
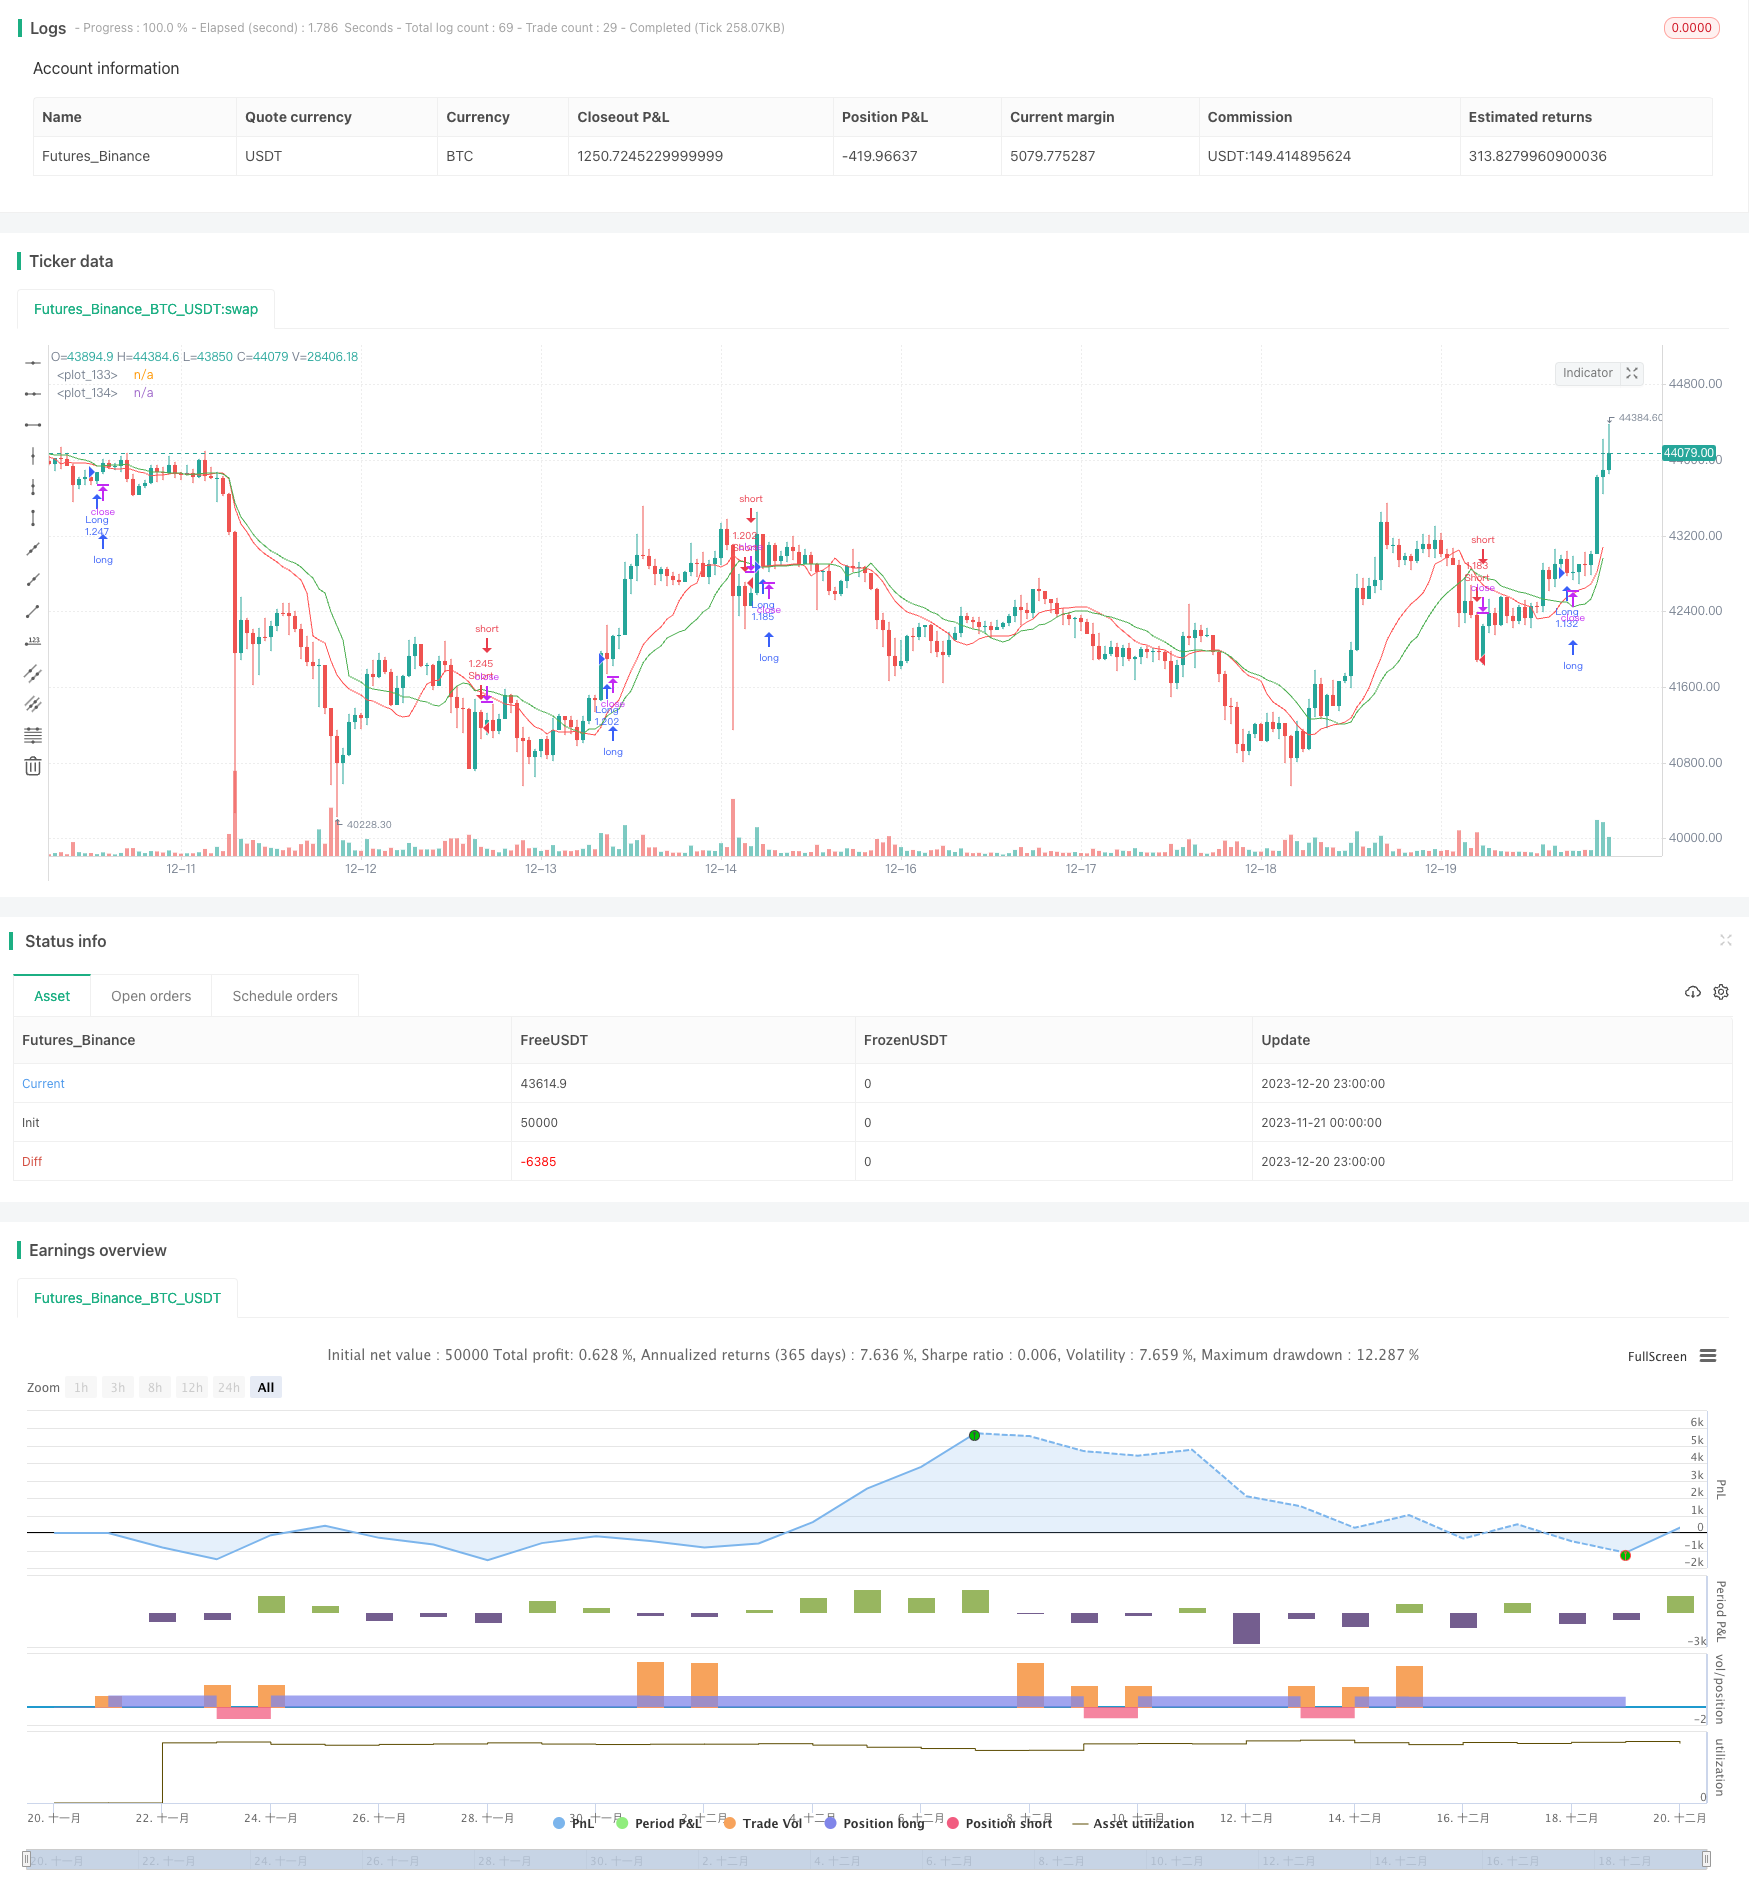
该策略是一个实验性的量化交易策略,它结合了移动平均线指标和机器学习的kNN算法来产生交易信号。该策略使用两条不同周期的VWMA均线的交叉来判断趋势方向,并结合MFI和ADX两个指标通过kNN算法对信号进行过滤,以提高信号的可靠性。
策略原理
该策略的核心指标是两条不同参数的VWMA均线,分别是快线和慢线。当快线上穿慢线时产生买入信号,快线下穿慢线时产生卖出信号。此外,该策略引入了MFI和ADX两个辅助指标,通过kNN分类算法判断当前市场情况下该信号的可靠性。
kNN算法的思想是将新数据与历史数据进行比较,判断最相近的k个历史数据所对应的结果,根据这k个历史结果按多数表决的方式进行分类。本策略将MFI和ADX作为kNN算法的两个输入参数,判断这两个指标组合时的历史价格走势(上涨或下跌),从而对当前信号进行过滤,提高信号质量。
策略优势
- 利用VWMA的趋势跟随能力,配合均线交叉产生买卖点
- 应用MFI和ADX指标进行多维特征提取,辅助判断趋势方向
- 借助kNN机器学习算法对交易信号进行动态优化和过滤
- 实验性策略,开发空间大,有待通过更多数据进行验证和优化
风险与对策
- VWMA均线容易产生滞后的问题
- MFI和ADX具有一定的滞后性,可能误判市场状况
- kNN算法参数设置(如k值选择)会对结果产生很大影响
- 实验性质策略,在实盘中可能表现不佳
对应对策:
- 调整均线参数,降低滞后程度
- 改进指标算法,提高对趋势的判断准确率
- 优化kNN算法的参数,提高拟合效果
- 利用回测和模拟实盘对策略进行验证
优化方向
该策略还有很大的优化空间:
- 增加更多均线指标,构建均线组合
- 尝试不同的辅助指标,如MACD、KDJ等
- 改进kNN算法,如使用不同距离度量方法
- 尝试其他机器学习算法,如SVM、随机森林等
- 进行参数优化,寻找最佳参数组合
通过引入更多指标和机器学习算法,有望进一步提高策略的稳定性和收益率。
总结
该策略是一个基于VWMA均线指标和kNN机器学习算法的实验性量化交易策略。它具有趋势跟随能力较强,同时通过机器学习进行信号过滤的特点。该策略空间广阔,通过引入更多特征和优化算法,有望产生更好的效果。但作为新型策略也存在一定的风险,有待进一步验证和改进。总的来说,该策略具有很大的创新潜力。
策略源码
/*backtest
start: 2023-11-21 00:00:00
end: 2023-12-21 00:00:00
period: 1h
basePeriod: 15m
exchanges: [{"eid":"Futures_Binance","currency":"BTC_USDT"}]
*/

// This source code is subject to the terms of the Mozilla Public License 2.0 at https://mozilla.org/MPL/2.0/
// © lastguru

//@version=4
strategy(title="VWMA with kNN Machine Learning: MFI/ADX", shorttitle="VWMA + kNN: MFI/ADX", overlay=true, default_qty_type=strategy.percent_of_equity, default_qty_value=100)

/////////
// kNN //
/////////

// Define storage arrays for: parameter 1, parameter 2, price, result (up = 1; down = -1)
var knn1 = array.new_float(1, 0)
var knn2 = array.new_float(1, 0)
var knnp = array.new_float(1, 0)
var knnr = array.new_float(1, 0)

// Store the previous trade; buffer the current one until results are in
_knnStore (p1, p2, src) =>
    var prevp1 = 0.0
    var prevp2 = 0.0
    var prevsrc = 0.0

    array.push(knn1, prevp1)
    array.push(knn2, prevp2)
    array.push(knnp, prevsrc)
    array.push(knnr, src >= prevsrc ? 1 : -1)

    prevp1 := p1
    prevp2 := p2
    prevsrc := src

// Sort two arrays (MUST be of the same size) based on the first.
// In other words, when an element in the first is moved, the element in the second moves as well.
_knnGet(arr1, arr2, k) =>
    sarr = array.copy(arr1)
    array.sort(sarr)
    ss = array.slice(sarr, 0, min(k, array.size(sarr)))
    m = array.max(ss)
    out = array.new_float(0)
    for i = 0 to array.size(arr1) - 1
        if (array.get(arr1, i) <= m)
            array.push(out, array.get(arr2, i))
    out

// Create a distance array from the two given parameters
_knnDistance(p1, p2) =>
    dist = array.new_float(0)
    n = array.size(knn1) - 1
    for i = 0 to n
        d = sqrt( pow(p1 - array.get(knn1, i), 2) + pow(p2 - array.get(knn2, i), 2) )
        array.push(dist, d)
    dist

// Make a prediction, finding k nearest neighbours
_knn(p1, p2, k) =>
    slice = _knnGet(_knnDistance(p1, p2), array.copy(knnr), k)
    knn = array.sum(slice)

////////////
// Inputs //
////////////

SRC = input(title="Source", type=input.source, defval=open)
FAST = input(title="Fast Length", type=input.integer, defval=13)
SLOW = input(title="Slow Length", type=input.integer, defval=19)
FILTER = input(title="Filter Length", type=input.integer, defval=13)
SMOOTH = input(title="Filter Smoothing", type=input.integer, defval=6)
KNN = input(title="kNN nearest neighbors (k)", type=input.integer, defval=23)
BACKGROUND = input(false,title = "Draw background")

////////
// MA //
////////
fastMA = vwma(SRC, FAST)
slowMA = vwma(SRC, SLOW)

/////////
// DMI //
/////////

// Wilder's Smoothing (Running Moving Average)
_rma(src, length) =>
    out = 0.0
    out := ((length - 1) * nz(out[1]) + src) / length

// DMI (Directional Movement Index)
_dmi (len, smooth) =>
    up = change(high)
    down = -change(low)
    plusDM = na(up) ? na : (up > down and up > 0 ? up : 0)
    minusDM = na(down) ? na : (down > up and down > 0 ? down : 0)
    trur = _rma(tr, len)
    plus = fixnan(100 * _rma(plusDM, len) / trur)
    minus = fixnan(100 * _rma(minusDM, len) / trur)
    sum = plus + minus
    adx = 100 * _rma(abs(plus - minus) / (sum == 0 ? 1 : sum), smooth)
    [plus, minus, adx]

[diplus, diminus, adx] = _dmi(FILTER, SMOOTH)

/////////
// MFI //
/////////

// common RSI function
_rsi(upper, lower) =>
    if lower == 0
        100
    if upper == 0
        0
	100.0 - (100.0 / (1.0 + upper / lower))

mfiUp = sum(volume * (change(ohlc4) <= 0 ? 0 : ohlc4), FILTER)
mfiDown = sum(volume * (change(ohlc4) >= 0 ? 0 : ohlc4), FILTER)
mfi = _rsi(mfiUp, mfiDown)

////////////
// Filter //
////////////

longCondition = crossover(fastMA, slowMA)
shortCondition = crossunder(fastMA, slowMA)

if (longCondition or shortCondition)
    _knnStore(adx, mfi, SRC)
filter = _knn(adx, mfi, KNN)

/////////////
// Actions //
/////////////

bgcolor(BACKGROUND ? filter >= 0 ? color.green : color.red : na)
plot(fastMA, color=color.red)
plot(slowMA, color=color.green)

if (longCondition and filter >= 0)
    strategy.entry("Long", strategy.long)
if (shortCondition and filter < 0)
    strategy.entry("Short", strategy.short)