概述
这是一个利用双重移动平均线交叉作为买入和卖出信号的简单量化策略。它使用两个不同周期的MA线,当短周期MA线从下方上穿长周期MA线时生成买入信号;当短周期MA从上方下穿长周期MA时生成卖出信号。
策略原理
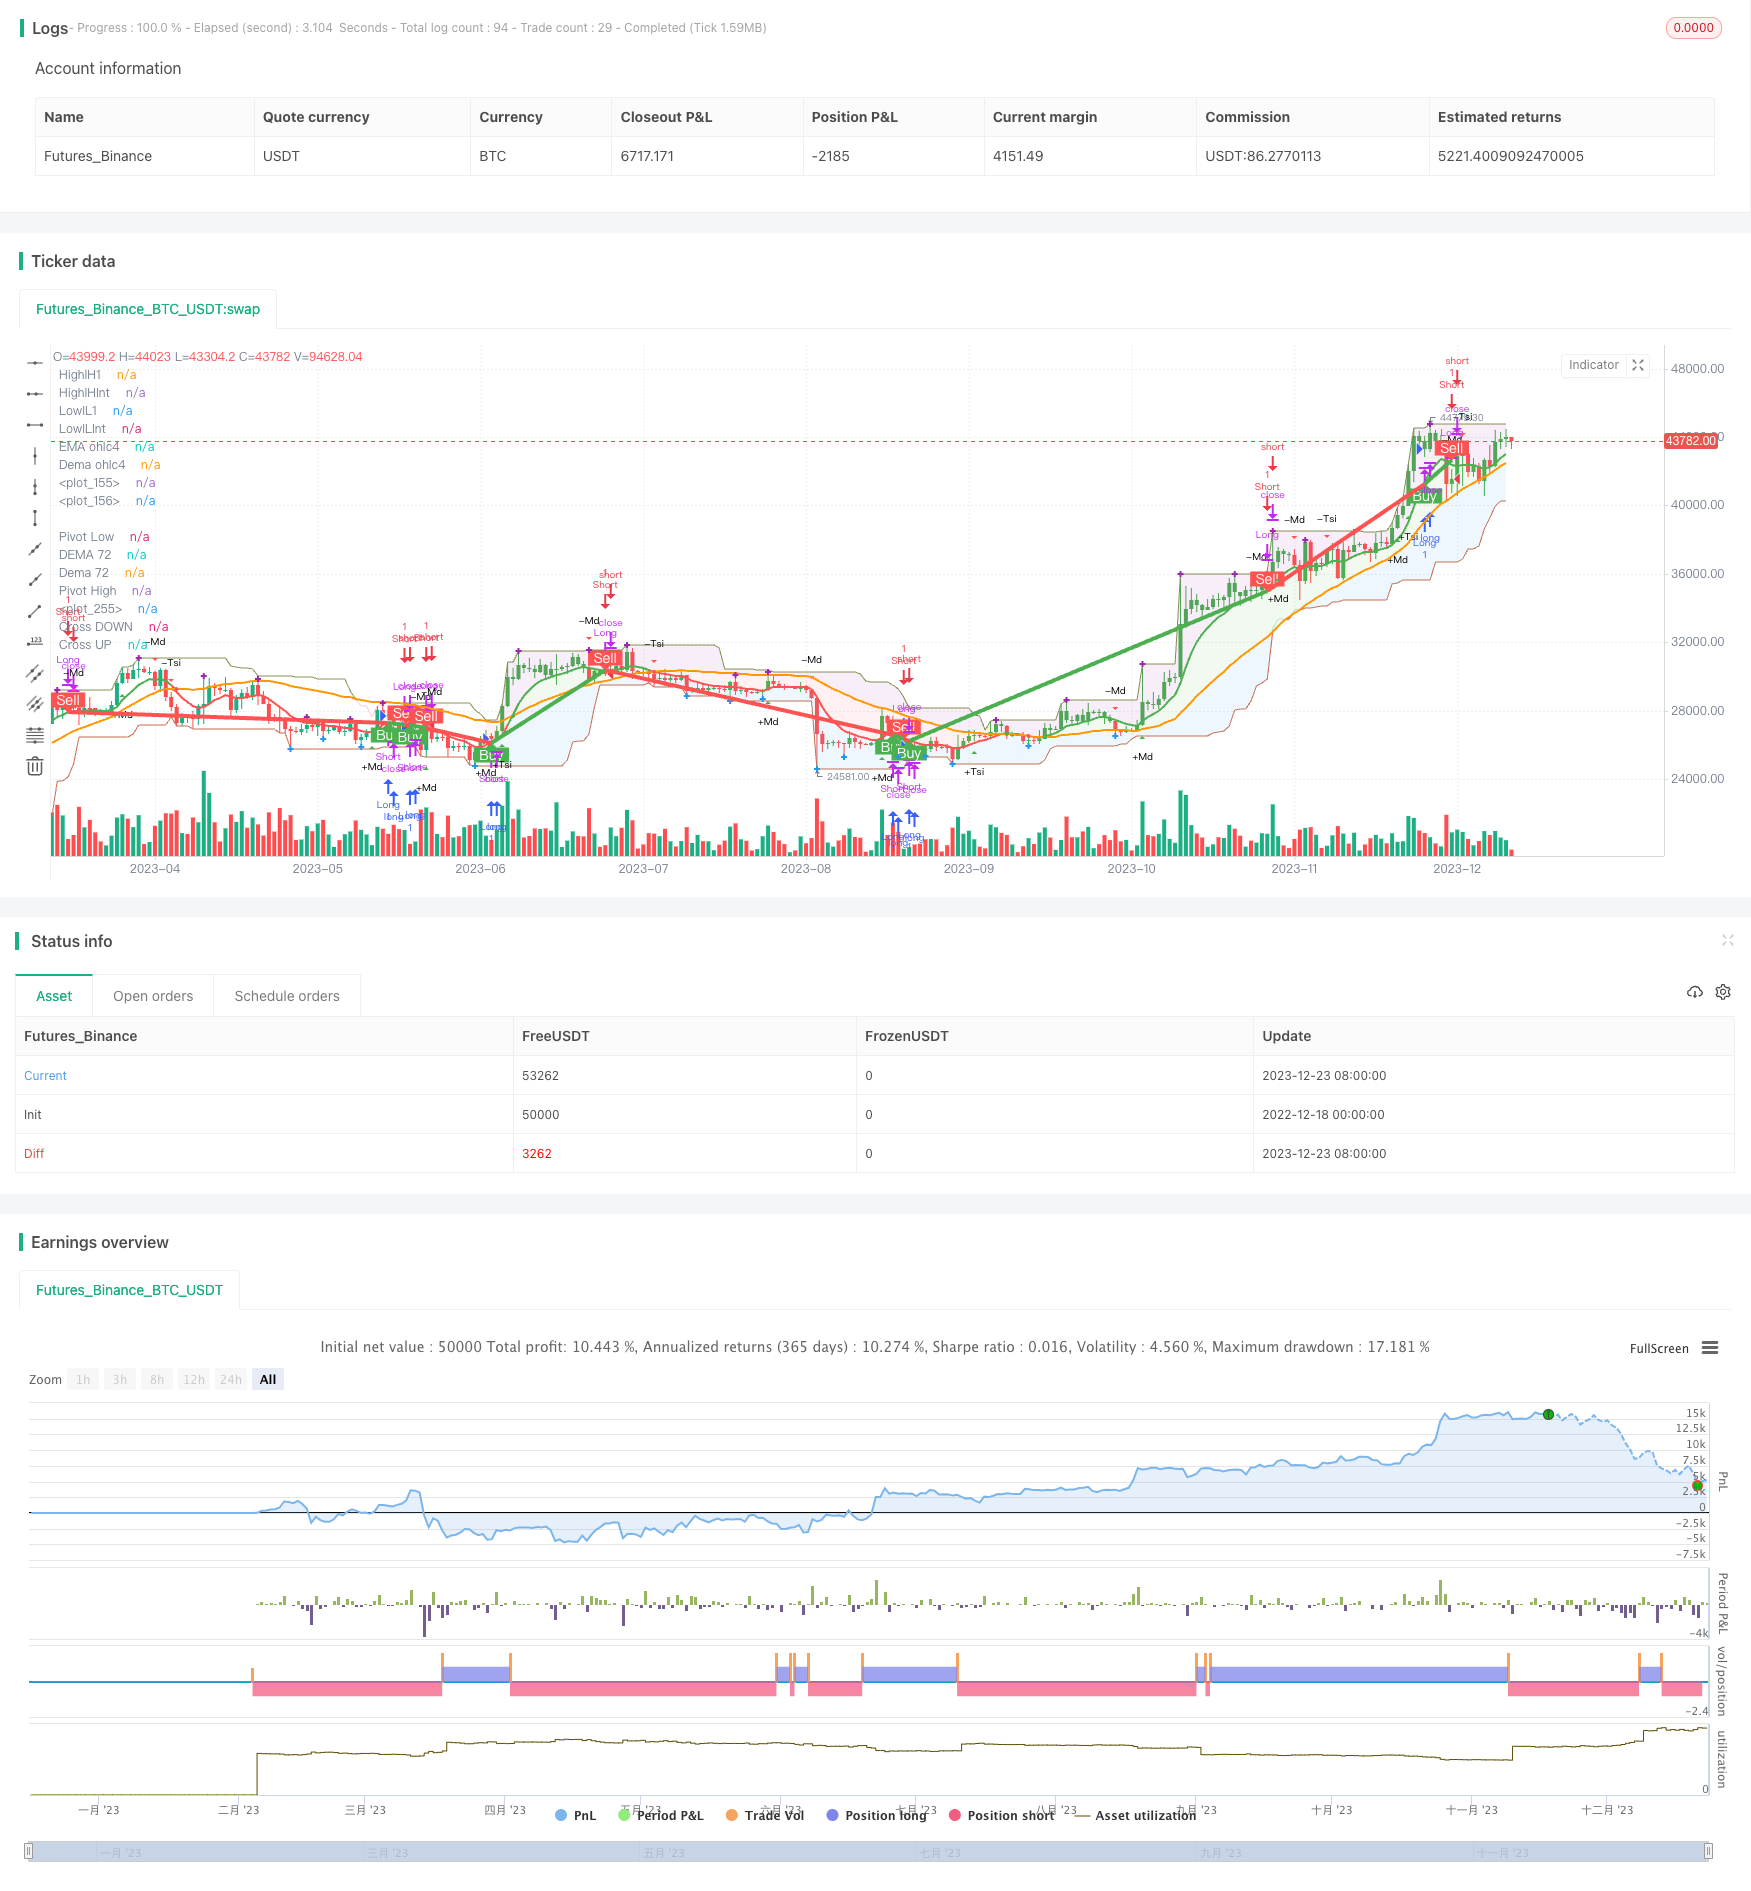
该策略通过计算close价格的8周期EMA和72周期EMA,并绘制在图表上。当8EMA上穿72EMA时,产生买入信号;当8EMA下穿72EMA时,产生卖出信号。
策略的基本假设是:短周期MA线代表近期价格趋势和动量,长周期MA线代表长期趋势。当短MA上穿长MA时,表示短期趋势正在变强,带动价格突破长期均线,因此可以买入。当短MA下穿长MA时,表示短期涨势已经结束,长期支撑位被突破,应当考虑卖出。
该策略还利用William %R指标判断超买超卖区域,MACD指标判断价格动量方向,为交易决策提供参考。 此外,策略中还设置了一些辅助指标如Dema, Pivots等为分析走势提供帮助。
优势分析
双MA交叉策略最大的优势在于简单易理解,容易实施。仅仅依靠两个MA的交叉就可以按照规则产生交易信号,不需要复杂的模型和参数优化。
另一个优势是,MA交叉策略在趋势型市场中表现较好。当股价出现明显的上涨或下跌趋势时,MA交叉策略可以抓住大趋势产生较好收益。
风险分析
双MA交叉策略也存在一些风险需要注意。首先,在盘整震荡的市场中,MA线交叉频繁,容易产生错误信号和链式亏损。其次,MA交叉信号常常滞后,无法及时反映突发事件的影响。最后,参数设置如MA周期长度等需要经验进行调整判断。
可以通过结合其他指标来确认信号,优化MA参数,或在趋势明显的市场操作来减少风险。此外设置止损止盈、进行仓位管理等也非常重要。
优化方向
这种简单的双MA策略可以在以下几个方面进行优化:
- 测试不同MA周期参数的组合,寻找最佳参数;
2.加入其他指标进行信号过滤,例如MACD、KDJ等,使策略更加稳定;
建立动态退出机制,跟踪最佳止损止盈位,而不是简单地使用固定值;
根据市场状态采用自适应 MA 周期,优化参数;
结合高级机器学习和深度学习模型进行预测,提高信号准确率。
总结
本策略作为一个简单的双MA交叉策略,虽然有一定的滞后性和假信号问题,但易于理解和实现。通过一定优化修改,仍可以成为基础且实用的量化交易策略。
/*backtest
start: 2022-12-18 00:00:00
end: 2023-12-24 00:00:00
period: 1d
basePeriod: 1h
exchanges: [{"eid":"Futures_Binance","currency":"BTC_USDT"}]
*/

// This source code is subject to the terms of the Mozilla Public License 2.0 at https://mozilla.org/MPL/2.0/
// © DalmarSantos
//@version=4
//Entry and Exit points to TRADE ==> Pontos de Entrada e Saida de TRADE
//Functions in use ==> Funções em uso
//(1) DEMA - Double Exponential Moving Average 08/17/34/72 ==> Média Móvel Exponencial Dupla
//(2) ema() - Exponential Moving Averge 72/ochl4 ==> Média Móvel Exponencial
//(3) plot()
//(4) barcolor()
//(5) cross()
//(6) pivots()
//(7) William R% Md
//(8) Maximum and Minimum Value
//(9) fill()
//(10) macd() - Moving Average Convergence Divergence
//(11) tsi() - Trading Strenght Indicator==> Índice de Força Real (IFR)
//(12) Buy and Sell TRADE Points
//(13) Strategy Buy and Sell TRADE Points
strategy("[DS]Entry_Exit_TRADE.V01-Strategy", overlay=true)
//variable ==> variáveis
return = input(title="Return Candels ?", type=input.integer, defval=190) //quantity of candles to analise ==> quantidade de candles para analise
//
//****************************
//Function==> Função | (1)DEMA
//****************************
//Dema 08
e1 = ema(close,8)
e2 = ema(e1,8)
dema08 = 2 * e1 - e2
//
//Dema 17
e1 := ema(close,17)
e2 := ema(e1,17)
dema17 = 2 * e1 - e2
//
//Dema 34
e1 := ema(close,34)
e2 := ema(e1,34)
dema34 = 2 * e1 - e2
//
//Dema 72
e1 := ema(close,72)
e2 := ema(e1,72)
dema72 = 2 * e1 - e2
//
//******************************
//Function==> Função | (2) ema()
//******************************
ema72 = ema(close,72)
emaOhlc4=ema(ohlc4,8)
//
//******************************
//Function==> Função | (3)plot()
//******************************
//
////Show the avareges ==> Apresenta as médias
//plot(dema17, title="DEMA 17", color=color.new(color.lime,0), linewidth=1, style=plot.style_line, transp=0, show_last=return) // Doble Exponential Moving Avarage 17
//plot(dema34, title="DEMA 34", color=color.new(color.black,0), linewidth=1, style=plot.style_line, transp=0, show_last=return) // Doble Exponential Moving Avarage 34

plot(dema72, title="DEMA 72", color=color.orange, linewidth=2, style=plot.style_line, transp=0, show_last=return) // Doble Exponential Moving Avarage 72
plot(emaOhlc4, title="EMA ohlc4", color=emaOhlc4>dema72 ? color.new(color.green,0) : color.new(color.red,0), linewidth=2, style=plot.style_line, transp=0, show_last=return) // Doble Exponential Moving Avarage 72
//
//***********************************
//Function==> Função | (4) barcolor()
//***********************************
//Show color TRADE bar if emaOhlc4>dema72 green (Buy) if not red (Red) ==> Mostra a cor da barra de TRADE se emaOhlc4>dema72 verde (Compra) se não vermelha (Venda)
barcolor(close>dema34 and close>dema72 or close>close[1]  ? color.new(color.green,0) : color.new(color.red,0), show_last=return)
//
//********************************
//Function==> Função | (5) cross()
//********************************
// Show the intersections crossing average on the graph ==> Apresenta no gráfico o local dos cruzamentos das médias
//UP ==> para CIMA
plot(crossover(emaOhlc4,dema72) ? dema72 : na, title="Cross UP", color=color.green, transp=0, style=plot.style_circles, linewidth=5, show_last=return)
//DOWM ==> para BAIXO
plot(crossunder(emaOhlc4,dema72) ? dema72 : na, title="Cross DOWN", color=color.red, transp=50, style=plot.style_circles, linewidth=5, show_last=return)
//
//********************************
//Function==> Função | (6) pivot()
//Reference: Pine Script Manual
//********************************
_Pivots	= input(title = "══════ Pivots ══════", type = input.bool, defval = false)
leftBars = input(4)
rightBars=input(4)
pivotHigh = pivothigh(leftBars, rightBars) //pivot de alta
plot(pivotHigh>ema72[rightBars] ? pivotHigh : na, title="Pivot High", style=plot.style_cross, linewidth=3, color= color.purple, transp=50, offset=-rightBars, show_last=return)
pivotLow = pivotlow(leftBars, rightBars) //pivot de baixa
plot(pivotLow<ema72[rightBars] ? pivotLow : na, title="Pivot Low", style=plot.style_cross, linewidth=3, color= color.blue, transp=50, offset=-rightBars, show_last=return)
//
//***************************************
//Function==> Função | (7) WILLIAM R% MOD
//Reference: Pine Script Manual
//***************************************
// Getting inputs
_WilliamR	= input(title = "══════ William R% Mod ══════", type = input.bool, defval = false)
SOB_William = input(title="OverBought Area", type=input.integer, defval=-7) //OverBought area ==> Area de SobreCompra
SOS_William = input(title="OverSold Area", type=input.integer, defval=-93) //OverSold area ==> Area de SobreVenda
length_William = input(17, minval=1) //interval ==> intervalo
highestHigh_William = highest(length_William) //maximum value ==> valor máximo
highestLow_William = lowest(length_William) //minumum value ==> valor mínimo
R_William = (highestHigh_William - close) / (highestHigh_William - highestLow_William) * -100
//Show the position ==> mostra a posição
//plotshape(R_William > SOS_William ? na : high, text="+R%", title="+r(+)%R Up", location=location.belowbar, color=color.green, transp=30, style=shape.triangleup, size=size.tiny, show_last=return)
//plotshape(R_William < SOB_William ? na : low, text="-R%", title="(-)%R DN", location=location.abovebar, color=color.red, transp=30, style=shape.triangledown, size=size.tiny, show_last=return)
//
// Show label with William %R value ==> Mostra a etiqueta com o valor do William %R
// The color label red is when the value arrive on OverBought Area and green on OverSold Area, be careful with these areas ==> O rótulo de cor vermelha é quando o valor chega na área de SobreCompra e verde na área de SobreVenda, cuidado com estas áreas
//
corTest=color.white
colorText = color.white
estilo = label.style_label_upper_left
textW=""
if R_William>SOB_William
    corTest := color.new(color.red,0) //vermelho escuro
    estilo := label.style_label_lower_left
    textW:="OB"

if R_William>-30 and R_William<=SOB_William
    corTest := #f5948e //vermelho intermediário
    estilo := label.style_label_lower_left

if R_William>-50 and R_William<=-30
    corTest := #f5d5d3 //vermelho claro
    colorText := color.black

if R_William>-70 and R_William<=-50
    corTest := #e7f5d3 //verde claro
    colorText := color.black

if R_William>=SOS_William and R_William<=-70
    corTest := color.lime //verde intermediario
    estilo := label.style_label_upper_left
    colorText := color.black

if R_William<SOS_William
    corTest := color.new(color.green,0) // verde escuro
    estilo := label.style_label_upper_left
    textW:="OS"
// Make a label at the high of the current bar
myLabel = label.new(x=bar_index, y=close, style= estilo, color=corTest, text=tostring(R_William,"#.#")+"% "+textW, textcolor=colorText, size=size.normal)
// Get the label text
labelText = label.get_text(id=myLabel)
// Then set the label's text to a new string that
// includes its current text
label.set_text(id=myLabel, text=labelText)
label.delete(myLabel[1])
//
//**************************************************
//Function==> Função | (8) MAXIMUM AND MINIMUM VALUE
//Reference: Pine Script Manual
//**************************************************
//Maximum High and Minimum Low close position ==> Posição Máxima e Minima de fechamento
ExtremoHigh=high+(highestHigh_William-high)
ExtremoLow=low-(low-highestLow_William)
plot(ExtremoHigh, color=color.new(color.red,70), style=plot.style_line, linewidth=1, show_last=return)
plot(ExtremoLow, color=color.new(color.green,70), style=plot.style_line, linewidth=1, show_last=return)
//Show the Extreme High and Low close position ==> Mostra a extrema posicao alta e baixa do fechamento
lH1 = 0.0
lHInt = close
lL1 = close
lLInt = close
Vr_LinhaH=0.0
Vr_LinhaL=0.0
Vr_LinhaC=0.0
if emaOhlc4<dema72
    Vr_LinhaH := high+(highestHigh_William-high)
    lH1 := Vr_LinhaH>dema72 ?  Vr_LinhaH : dema72
    lHInt:=emaOhlc4<dema72 ? dema72 : emaOhlc4
    lLInt := lHInt==emaOhlc4 ? dema72 : emaOhlc4
    Vr_LinhaL:= low-(low-highestLow_William)
    lL1 := Vr_LinhaL>lLInt ?  lLInt : Vr_LinhaL

if emaOhlc4>dema72
    Vr_LinhaH := high+(highestHigh_William-high)
    lH1 := Vr_LinhaH>dema72 ?  Vr_LinhaH : dema72
    lHInt:=dema72>emaOhlc4 ? dema72 : emaOhlc4
    lLInt := lHInt==dema72 ? emaOhlc4 : dema72
    Vr_LinhaL:= low-(low-highestLow_William)
    lL1 := Vr_LinhaL>lLInt ?  lLInt : Vr_LinhaL
//
//*******************************
//Function==> Função | (9) fill()
//Reference: Pine Script Manual
//*******************************
//Show TRADE area in red (Sell) and green (Buy) ==> Mostra a área de trade em vermelho (Venda) e verde (Compra)
Line1 = plot(emaOhlc4, title="Dema ohlc4", color=color.new(color.white,100), linewidth=1, transp=0, show_last=return)
Line2 = plot(dema72,  title="Dema 72", color=color.new(color.white,100), linewidth=1,transp=0, show_last=return)
fill(Line1, Line2, color=emaOhlc4>dema72 ? color.new(color.green,90) : color.new(color.red,90), transp=70, show_last=return)

//High area ==> Area de alta
HighlH1 = plot(lH1, title="HighlH1", color=color.green, linewidth=1, transp=90, show_last=return, style=plot.style_linebr)
HighlHInt = plot(lHInt, title="HighlHInt", color=color.green, linewidth=1, transp=100, show_last=return, style=plot.style_linebr)
fill(HighlH1, HighlHInt, color=color.new(color.purple,90),  transp=0, show_last=return)

//Low area ==> Area de baixa
LowlL1 = plot(lL1, title="LowlL1", color=color.red, linewidth=1, transp=90, show_last=return, style=plot.style_linebr)
LowlLInt = plot(lLInt, title="LowlLInt", color=color.red, linewidth=1, transp=100, show_last=return, style=plot.style_linebr)
fill(LowlL1, LowlLInt, color=color.new(color.blue,90),  transp=0, show_last=return)
//
//***************************************************************************
//Function==> Função | (10) macd() - Moving Average Convergence Divergence
//Reference: Pine Script Manual - adapted TradingView version - Dalmar Santos
//***************************************************************************
// Getting inputs
_Macd	= input(title = "═════ Macd ══════════", type = input.bool, defval = false)
fast_length_Macd = input(title="Fast Length", type=input.integer, defval=12)
slow_length_Macd = input(title="Slow Length", type=input.integer, defval=26)
src_Macd = input(title="Source", type=input.source, defval=close)
signal_length_Macd = input(title="Signal Smoothing", type=input.integer, minval = 1, maxval = 50, defval = 9)
// Calculating
fast_ma_Macd = ema(src_Macd, fast_length_Macd)
slow_ma_Macd = ema(src_Macd, slow_length_Macd)
macd_Macd = fast_ma_Macd - slow_ma_Macd
signal_Macd = ema(macd_Macd, signal_length_Macd)
hist_Macd = macd_Macd - signal_Macd
//cross Macd
MacdUp = crossover(macd_Macd,signal_Macd) ? 1 : 0
MacdDown = crossunder (macd_Macd,signal_Macd) ? 1 : 0
plotshape(MacdUp, text="+Md", title="(+)MACD UP", location=location.belowbar, color=color.green, transp=30, style=shape.triangleup, size=size.tiny, show_last=return)
plotshape(MacdDown, text="-Md", title="(-)MACD DN", location=location.abovebar, color=color.red, transp=30, style=shape.triangledown, size=size.tiny, show_last=return)
//
//*****************************************************************************************
//Function==> Função | (11) tsi() - Trading Strenght Indicator ==> Indice de Força do Trading
//Reference: Pine Script Manual - adapted TradingView version - Dalmar Santos
//*****************************************************************************************
_Tsi	= input(title = "═════ Tsi ══════════", type = input.bool, defval = false)
long_tsi = input(title="Long Length", type=input.integer, defval=72)
short_tsi = input(title="Short Length", type=input.integer, defval=17)
signal_tsi = input(title="Signal Length", type=input.integer, defval=17)
price_tsi = close
double_smooth(src_tsi, long_tsi, short_tsi) =>
	fist_smooth_tsi = ema(src_tsi, long_tsi)
	ema(fist_smooth_tsi, short_tsi)
pc_tsi = change(price_tsi)
double_smoothed_pc_tsi = double_smooth(pc_tsi, long_tsi, short_tsi)
double_smoothed_abs_pc_tsi = double_smooth(abs(pc_tsi), long_tsi, short_tsi)
tsi_value_tsi = 100 * (double_smoothed_pc_tsi / double_smoothed_abs_pc_tsi)
//TSI signal ==> Signal do TSI
TsiUp = crossover(tsi_value_tsi,ema(tsi_value_tsi, signal_tsi)) ? 1 : 0
TsiDown = crossunder(tsi_value_tsi,ema(tsi_value_tsi, signal_tsi)) ? 1 : 0
//Show the Position ==> Mostra a posicao
plotshape(TsiUp==1 ? low : na, text="+Tsi", title="(+)TSI Up", location=location.belowbar, color=color.green, transp=30, style=shape.triangleup, size=size.tiny, show_last=return)
plotshape(TsiDown==1 ? high : na, text="-Tsi", title="(-)TSI DN", location=location.abovebar, color=color.red, transp=30, style=shape.triangledown, size=size.tiny, show_last=return)
//
//***************************************************************************
//Function==> Função | (12) Buy and Sell TRADE Points
//Reference: Pine Script Manual - adapted TradingView version - Dalmar Santos
//***************************************************************************
//Cross Point ==> pontos de cruzamento
crossUP=crossover(emaOhlc4,dema34)
crossDN=crossunder(emaOhlc4,dema34)
//Show de Buy and Sell points ==> mostra pontos de compra e venda
tradeColor=crossUP ? color.red : crossDN ? color.green : na
//line buy or sell ==> linha de compra ou venda
plot(crossUP ? dema34 : crossDN ? dema34: na, color=tradeColor, style=plot.style_line, linewidth=4, editable=false, show_last=return)
//Buy point ==> pontos de compra
plotshape(crossUP ? dema34 : na, style=shape.labelup, location=location.absolute, text="Buy", transp=0, textcolor = color.white, color=color.green, editable=false, show_last=return)
//Sell points ==> pontos de venda
plotshape(crossDN ? dema34: na, style=shape.labeldown, location=location.absolute, text="Sell", transp=0, textcolor = color.white, color=color.red, editable=false, show_last=return)
//
//************************************************************
//Function==> Função | (13) Strategy Buy and Sell TRADE Points
//Reference: Pine Script Manual - Dalmar Santos
//************************************************************
//Start backtest year, month, day, hour, minute, second ==> Inicio do backtest ano, mês, dia, hora, minuto, segundo
start = timestamp(2021,01,01,1,00,00)
//*****************
//BUY ==> COMPRA
//*****************
if time>= start
    if crossUP
        strategy.close("Short", comment="Close Sell")
        strategy.entry("Long", strategy.long, 1, comment="Open Buy")

//*****************
//SELL ==> Venda
//*****************
    if crossDN
        strategy.close("Long", comment="Close Buy")
        strategy.entry("Short", strategy.short, 1, comment="Open Sell")