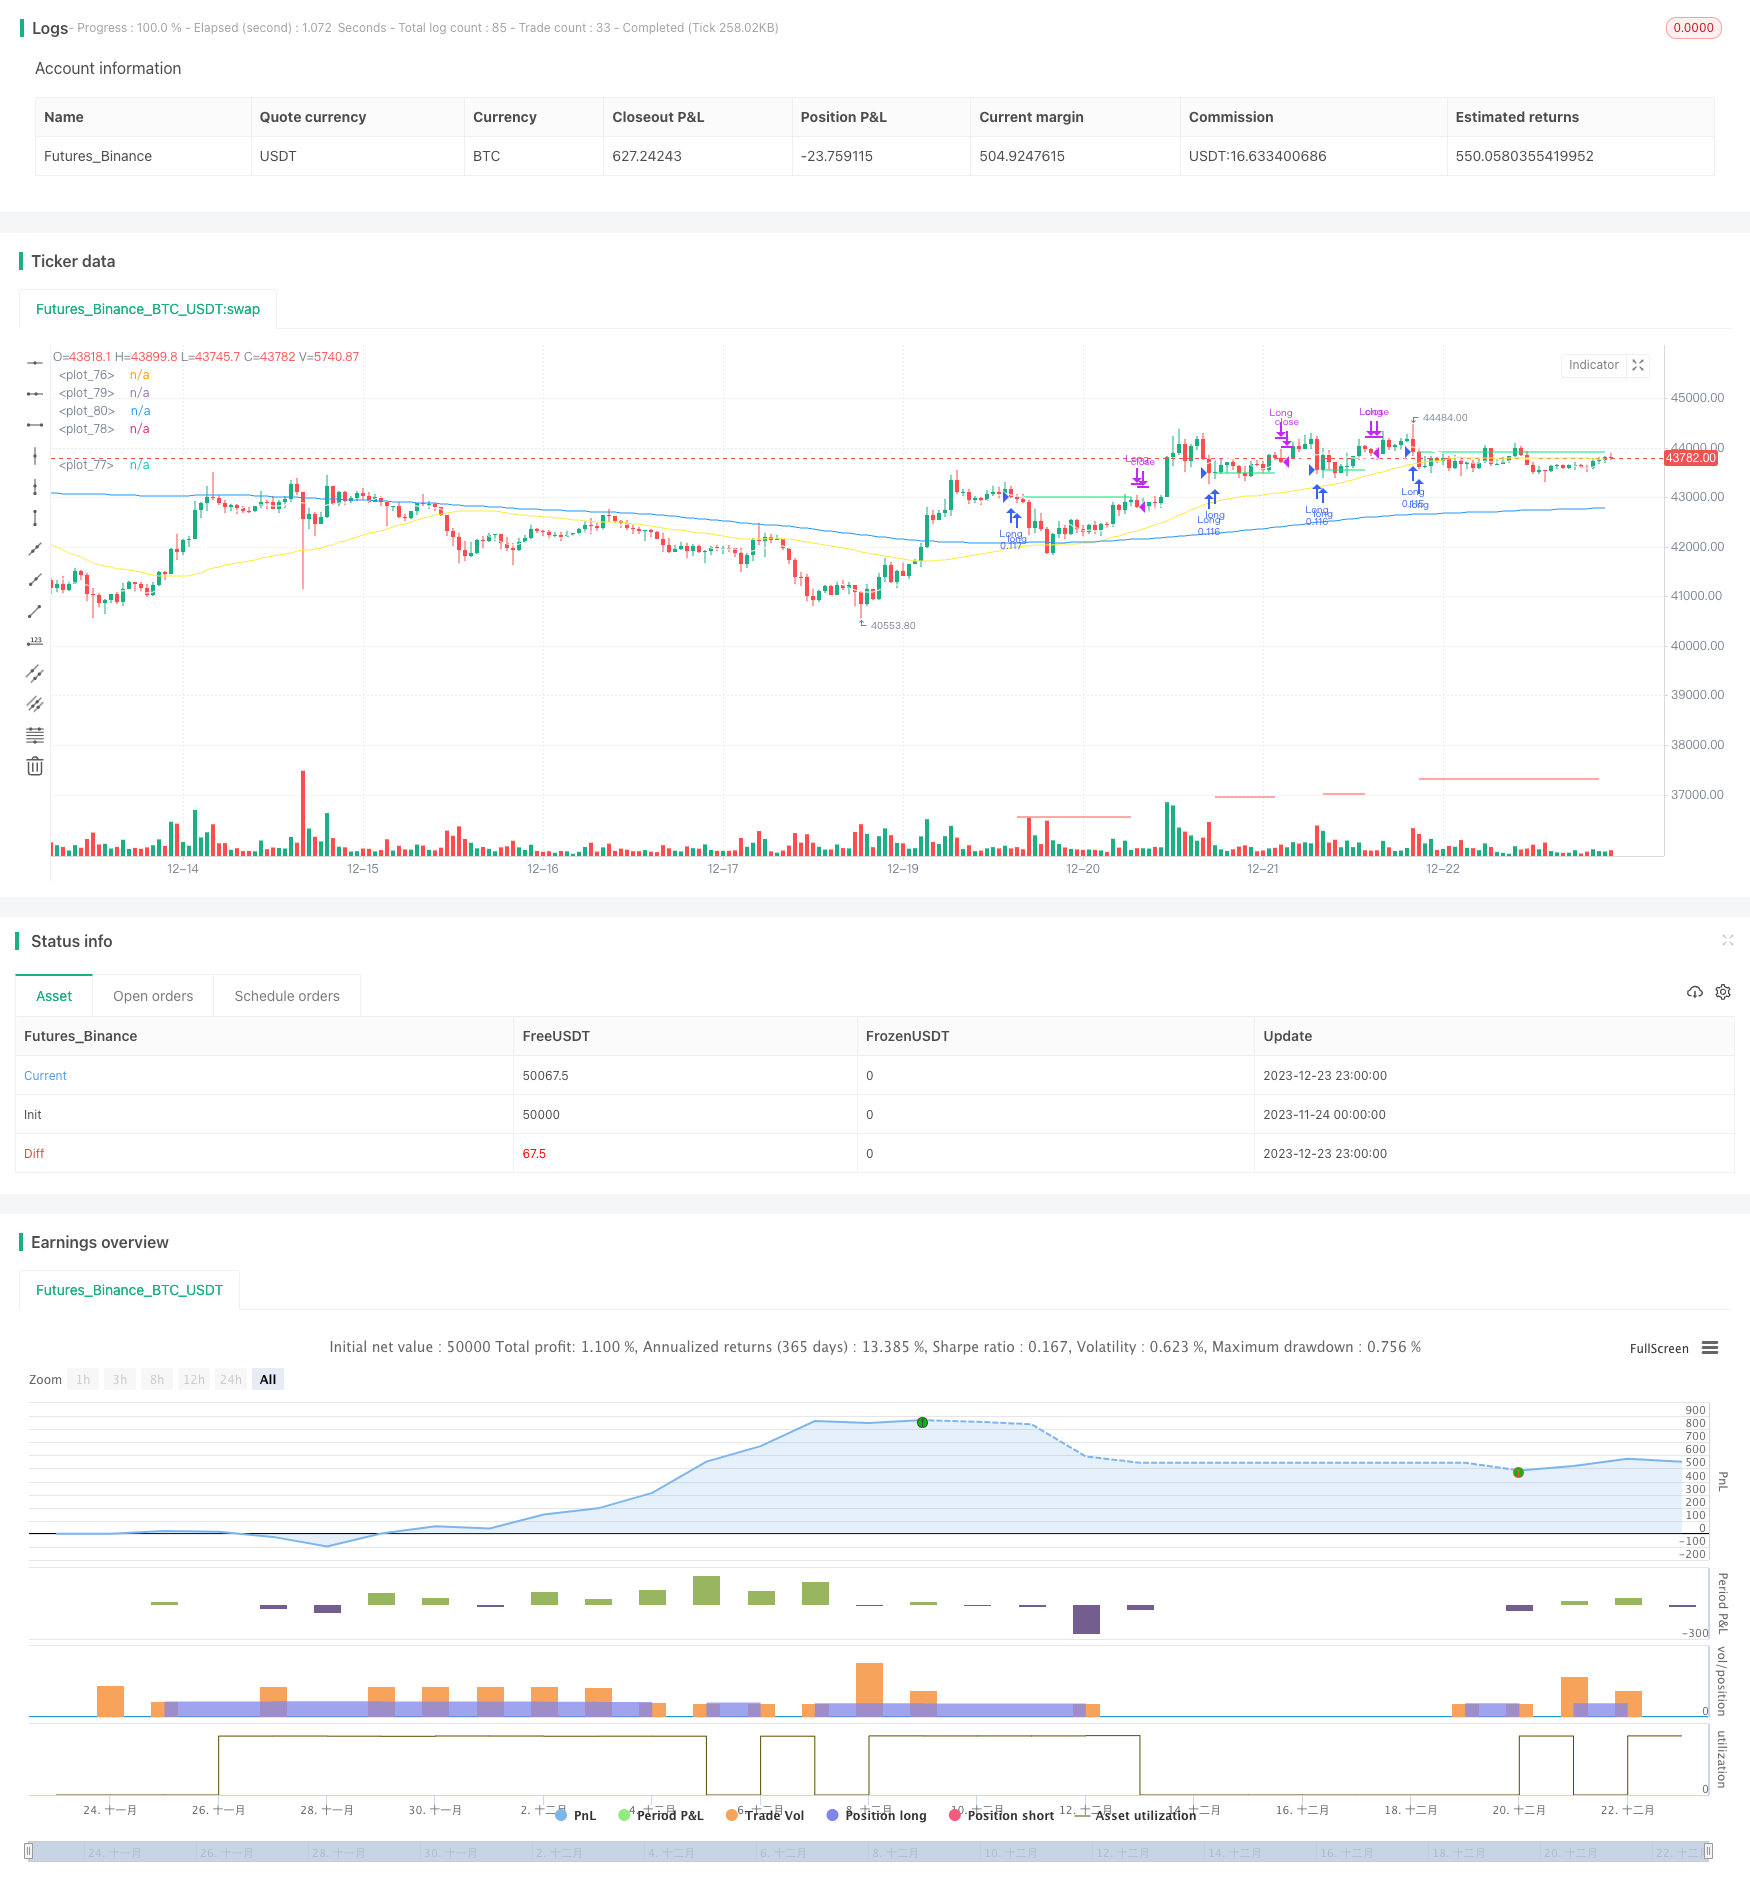
概述
双移动平均线反转策略(Dual Moving Average Reversal Strategy)是一个利用双移动平均线来识别短期和长期趋势的量化交易策略。该策略结合10日简单移动平均线和200日简单移动平均线,在长期看涨的大趋势下,捕捉短期回调买入机会。同时,该策略还具有一定的趋势跟踪和损失控制机制。
策略原理
双移动平均线反转策略主要基于以下假设:
200日简单移动平均线能够识别市场的长期趋势方向。当价格高于200日线时,代表大盘处于长期看涨趋势。
10日简单移动平均线能够识别市场的短期拉回。当价格低于10日线时,代表短期内出现回调。
在长期看涨的趋势下,任何短期回调都可被视为一个低吸机会,可以高效率的进行捕捉。
基于以上假设,该策略的交易信号生成逻辑为:
当收盘价上穿200日线,且同时下穿10日线时,代表长期趋势看涨,短期出现回调,因此产生买入信号。
当持有头寸时,如果收盘价重新上穿10日线,代表短期趋势反转,应立即止损离场。此外,如果股价有较大幅度下跌导致亏损达到事先设定的止损线,也会主动止损。
当大盘整体出现较大幅度下跌时,可作为低吸的机会,通过事先设定的跌幅阈值来判断买入时机。
通过这样的设计,可在牛市长期看涨的大趋势下,有效地进行低吸追涨,并设置止损来控制风险。
策略优势
双移动平均线反转策略具有以下几个优势:
- 策略思路清晰简单,容易理解和实现。
- 利用双移动平均线过滤器,可以有效识别大盘和个股的长短期趋势。
- 具有较好的时效性。通过捕捉短期反转,可以获得较高的资金使用效率。
- 内置止损机制,可以很好的控制个别仓位的损失。
- 可以灵活设置参数,适用于大盘指数和热门个股。
策略风险
尽管双移动平均线反转策略优势明显,但也存在以下一些风险:
- 大盘处于长期盘整时,容易产生误信号,从而影响策略表现。此时需要暂停策略,等待明确趋势再启用。
- 仅依靠移动平均线来判断趋势和产生信号,可能会漏掉其他有效特征。可以考虑引入更多指标进行组合优化。
- 单一止损方式可能过于死板,可以测试不同类型的止损机制。
- 策略参数需要针对不同标的进行调整优化,否则会影响稳定性。
策略优化方向
双移动平均线反转策略还有如下几个可优化的方向:
- 测试不同长度的移动平均线组合,寻找最优参数。
- 增加其他辅助指标,形成更稳定的信号。比如成交量,震荡指标等。
- 测试不同类型的止损方式。如跟踪止损,时间止损等。
- 优化买入和止损的参数,使其能自适应变化的市场情况。
- 增加机器学习算法,利用更多历史数据对参数进行优化。
总结
双移动平均线反转策略整体而言是一个非常实用的量化策略。它利用移动平均线的优点,在长线多头行情中进行低吸与止损,从而获得较高的单轮收益。同时它也具备一定的大盘识别能力和风险控制。通过持续的测试与优化,相信该策略的表现会更加出色。
策略源码
/*backtest
start: 2023-11-24 00:00:00
end: 2023-12-24 00:00:00
period: 1h
basePeriod: 15m
exchanges: [{"eid":"Futures_Binance","currency":"BTC_USDT"}]
*/

// This source code is subject to the terms of the Mozilla Public License 2.0 at https://mozilla.org/MPL/2.0/
// © Gold_D_Roger
//note: spreading 1 statement over multiple lines needs 1 apce + 1 tab | multi line function is 1 tab
//Recommended tickers: SPY (D), QQQ (D) and big indexes, AAPL (4H)

//@version=5
strategy("Davin's 10/200MA Pullback on SPY Strategy v2.0",
     overlay=true,
     initial_capital=10000,
     default_qty_type=strategy.percent_of_equity,
     default_qty_value=10, // 10% of equity on each trade
     commission_type=strategy.commission.cash_per_contract,
     commission_value=0.1) //Insert your broker's rate, IB is 0.005USD or tiered

//Best parameters
// SPY D
// Stop loss 0.15
// commission of 0.005 USD using Interactive brokers
// Exit on lower close
// Buy more when x% down --> 14%
// DO NOT include stop condition using MA crossover

// Get User Input
i_ma1           = input.int(title="MA Length 1", defval=200, step=10, group="Strategy Parameters", tooltip="Long-term MA 200")
i_ma2           = input.int(title="MA Length 2", defval=10, step=10, group="Strategy Parameters", tooltip="Short-term MA 10")
i_ma3           = input.int(title="MA Length 3", defval=50, step=1, group="Strategy Parameters", tooltip="MA for crossover signals`")
i_stopPercent   = input.float(title="Stop Loss Percent", defval=0.15, step=0.01, group="Strategy Parameters", tooltip="Hard stop loss of 10%")
i_startTime     = input(title="Start filter", defval=timestamp("01 Jan 2013 13:30 +0000"), group="Time filter", tooltip="Start date and time to begin")
i_endTime       = input(title="End filter", defval=timestamp("01 Jan 2099 19:30 +0000"), group="Time filter", tooltip="End date and time to stop")
i_lowerClose    = input.bool(title="Exit on lower close", defval=true, group="Strategy Parameters", tooltip="Wait for lower close after above 10SMA before exiting") // optimise exit strat, boolean type creates tickbox type inputs
i_contrarianBuyTheDip = input.bool(title="Buy whenever more than x% drawdown", defval=true, group="Strategy Parameters", tooltip="Buy the dip! Whenever x% or more drawdown on SPY")
i_contrarianTrigger = input.int(title="Trigger % drop to buy the dip", defval=14, step=1, group="Strategy Parameters", tooltip="% drop to trigger contrarian Buy the Dip!")
//14% to be best for SPY 1D
//20% best for AMZN 1D
i_stopByCrossover_MA2_3 = input.bool(title="Include stop condition using MA crossover", defval=false, group="Strategy Parameters", tooltip="Sell when crossover of MA2/1 happens")

// Get indicator values
ma1 = ta.sma(close,i_ma1) //param 1
ma2 = ta.sma(close,i_ma2) //param 2
ma3 = ta.sma(close,i_ma3) //param 3
ma_9 = ta.ema(close,9) //param 2
ma_20 = ta.ema(close,20) //param 3

// Check filter(s)
f_dateFilter = true //make sure date entries are within acceptable range

// Highest price of the prev 52 days: https://www.tradingcode.net/tradingview/largest-maximum-value/#:~:text=()%20versus%20ta.-,highest(),max()%20and%20ta.
highest52 = ta.highest(high,52)
overall_change = ((highest52 - close[0]) / highest52) * 100

// Check buy/sell conditions
var float buyPrice = 0 //intialise buyPrice, this will change when we enter a trade ; float = decimal number data type 0.0
buyCondition  = (close > ma1 and close < ma2 and strategy.position_size == 0 and f_dateFilter) or (strategy.position_size == 0 and i_contrarianBuyTheDip==true and overall_change > i_contrarianTrigger and f_dateFilter) // higher than 200sma, lower than short term ma (pullback) + avoid pyramiding positions
sellCondition = close > ma2 and strategy.position_size > 0 and (not i_lowerClose or close < low[1])  //check if we already in trade + close above 10MA;
// third condition: EITHER i_lowerClose not turned on OR closing price has to be < previous candle's LOW [1]

stopDistance  = strategy.position_size > 0 ? ((buyPrice - close)/close) : na // check if in trade > calc % drop dist from entry, if not na
stopPrice     = strategy.position_size > 0 ? (buyPrice - (buyPrice * i_stopPercent)) : na // calc SL price if in trade, if not, na
stopCondition = (strategy.position_size > 0 and stopDistance > i_stopPercent) or (strategy.position_size > 0 and (i_stopByCrossover_MA2_3==true and ma3 < ma1))


// Enter positions
if buyCondition
    strategy.entry(id="Long", direction=strategy.long) //long only


if buyCondition[1] // if buyCondition is true prev candle
    buyPrice := open // entry price = current bar opening price

// Exit position
if sellCondition or stopCondition
    strategy.close(id="Long", comment = "Exit" + (stopCondition ? "Stop loss=true" : "")) // if condition? "Value for true" : "value for false"
    buyPrice := na //reset buyPrice

// Plot
plot(buyPrice, color=color.lime, style=plot.style_linebr)
plot(stopPrice, color=color.red, style=plot.style_linebr, offset = -1)
plot(ma1, color=color.blue) //defval=200
plot(ma2, color=color.white) //defval=10
plot(ma3, color=color.yellow) // defval=50