概述
该策略基于相对强弱指数(RSI)指标设计,针对RSI低点买入,高点止损止盈的多头趋势追踪交易策略。当RSI指标低于超买线时生成买入信号,当RSI指标高于超卖线时生成卖出信号。策略优化追踪趋势的表现,能够有效控制交易风险。
策略原理
该策略使用RSI指标判断股票价格是否被高估或低估。RSI指标结合超买超卖线,形成买入和卖出信号。具体来说,如果RSI指标上穿20的超卖线,产生买入信号;如果RSI指标下穿80的超买线,产生卖出信号。
进入多头仓位后,策略设置一个初始止损线,以控制下行风险。同时设置两个不同比例的止盈线,分批止盈以锁定利润。具体来说,最先止盈50%的头寸,止盈价为买入价格的3%;然后止盈剩余50%的头寸, 止盈价为买入价格的5%。
该策略简洁有效地利用RSI指标判断入市时机。止盈止损设置合理,可以有效控制风险。
策略优势
- 利用RSI指标判断多空,避免盲目做多
- RSI指标参数经过优化,指标效果更佳
- 双止盈设计合理,可以实现分批止盈,锁定更多利润
- 初止损和连续止损防止巨额亏损
风险分析
- 多头策略,无法持续盈利的牛市中效果欠佳
- RSI指标发出错误信号的概率存在,信号判断不当可能增加损失
- 止损点过深造成无法止损的风险
- 缺乏对加仓次数和比例的限制,可能造成亏损放大
优化方向
- 结合其他指标过滤RSI信号,提高信号准确率
- 加入对加仓次数和比例的限制
- 测试不同RSI参数的效果
- 优化止损止盈点,降低风险
总结
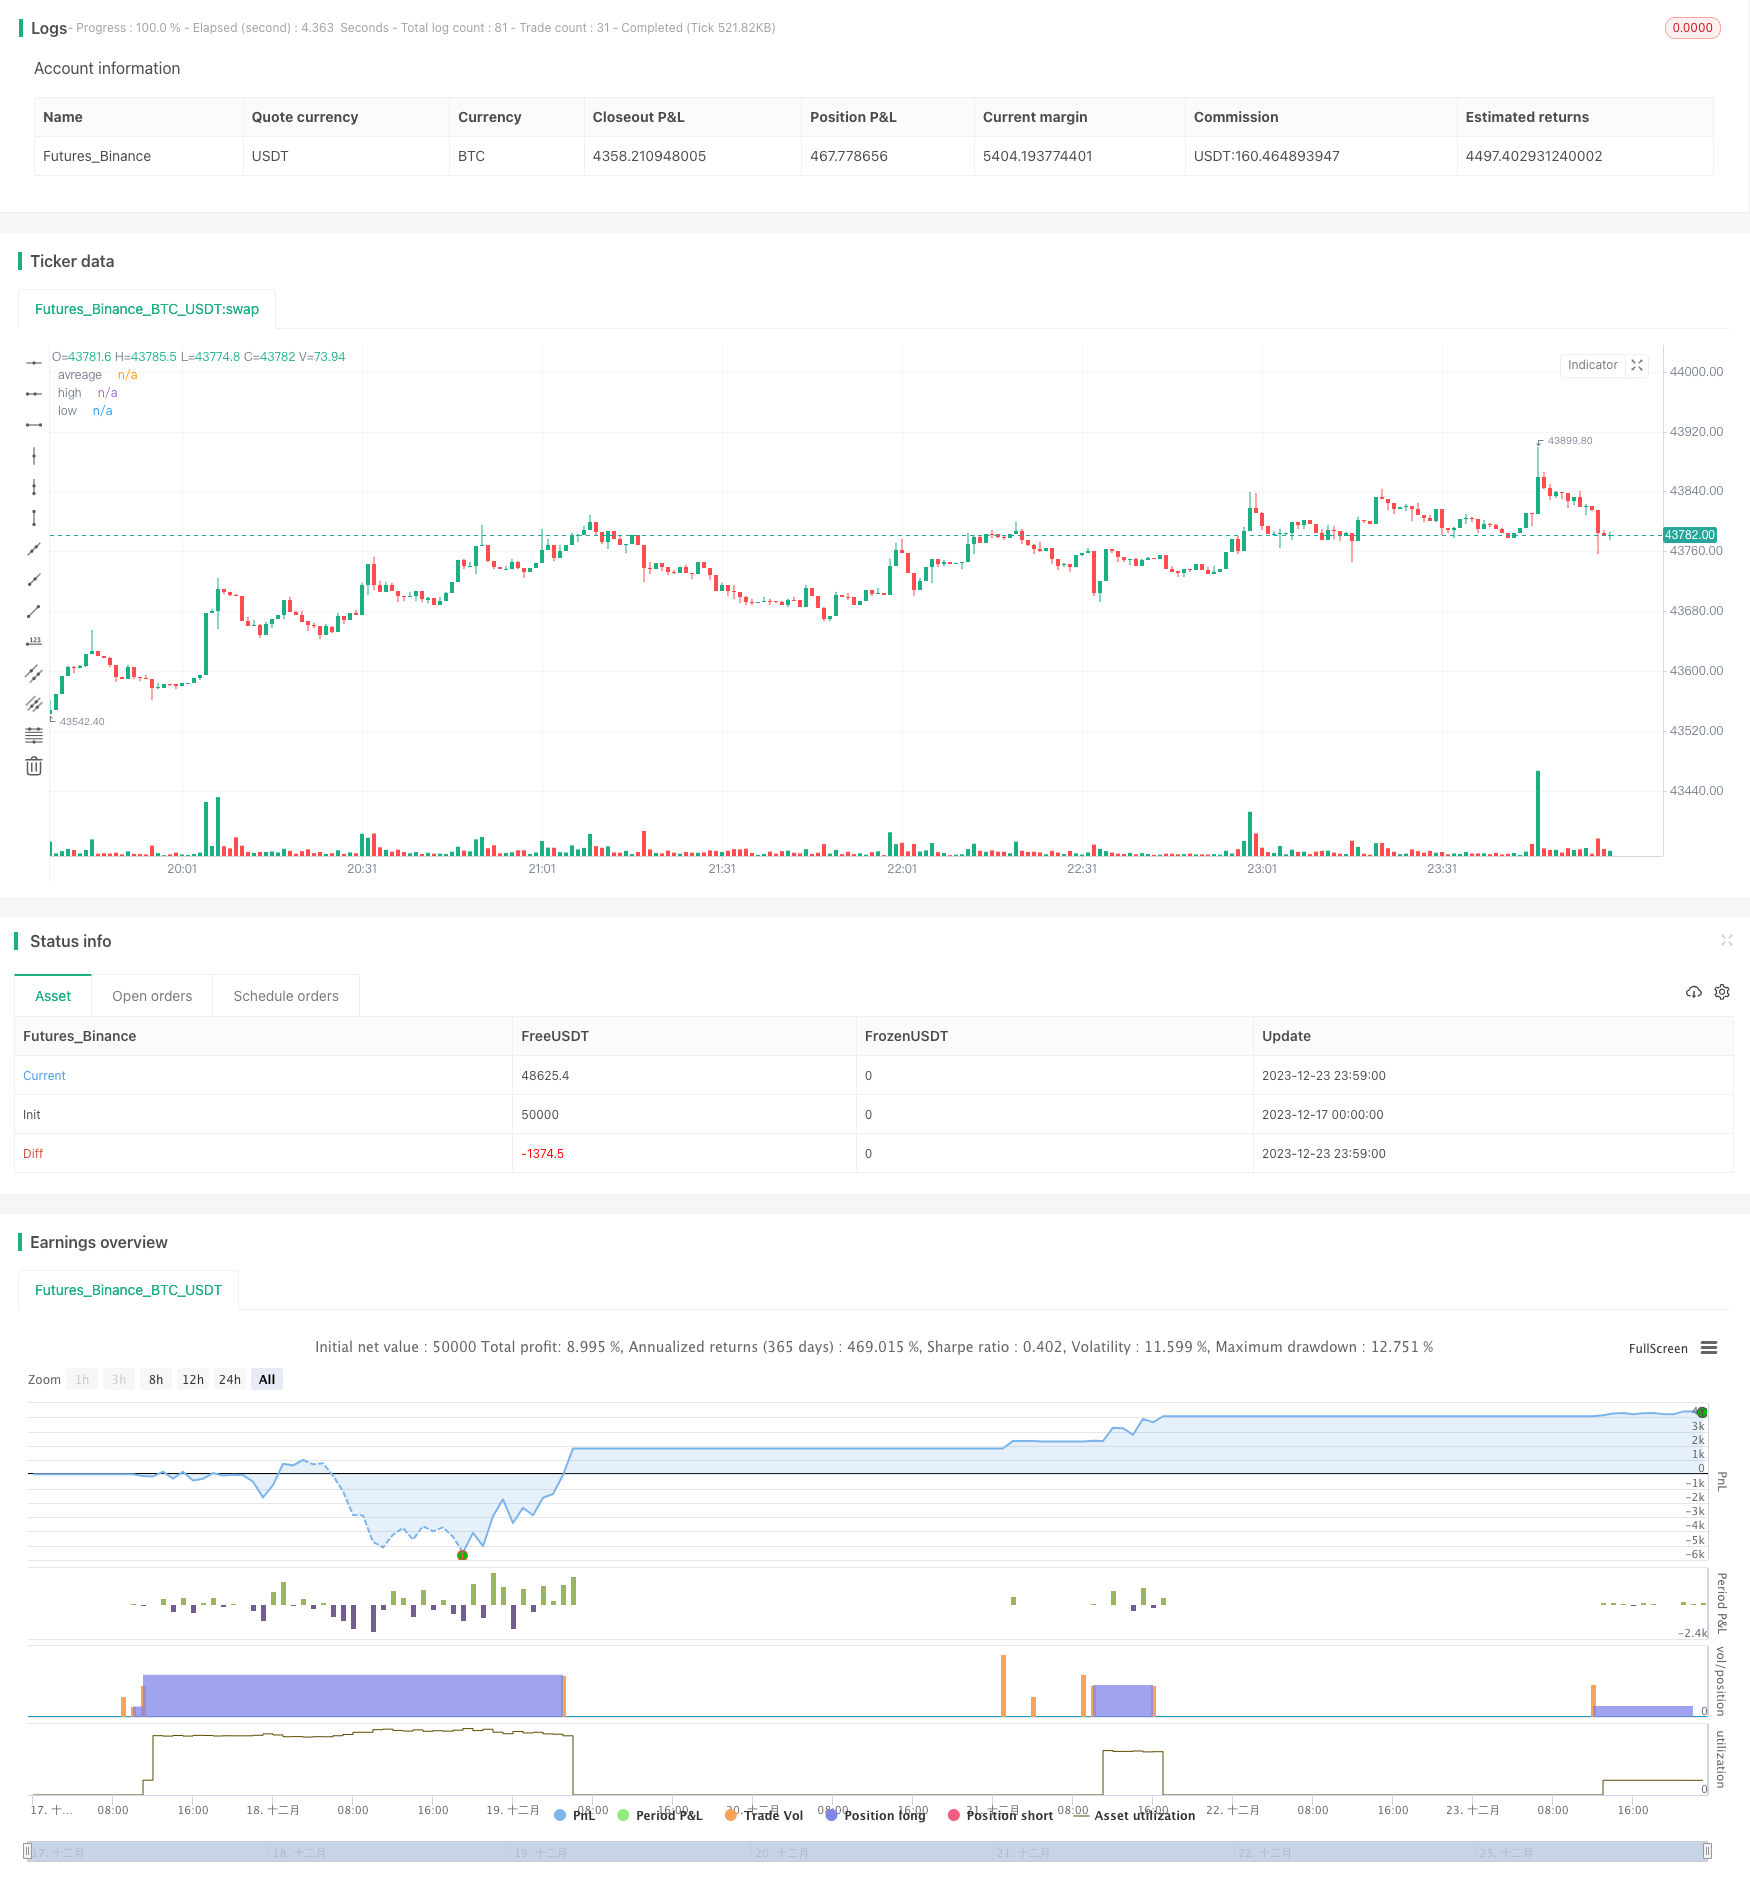
该策略运用RSI指标判断行情,止盈止损设置合理。可有效判断行情趋势,控制交易风险,适合作为多头追踪策略使用。通过信号过滤、参数测试、止损优化等方式可进一步提升策略的稳定性。
策略源码
/*backtest
start: 2023-12-17 00:00:00
end: 2023-12-24 00:00:00
period: 1m
basePeriod: 1m
exchanges: [{"eid":"Futures_Binance","currency":"BTC_USDT"}]
*/

// This source code is subject to the terms of the Mozilla Public License 2.0 at https://mozilla.org/MPL/2.0/

//@version=5

strategy(title='RSI Long Strategy', overlay=true, pyramiding=5, initial_capital=10000, default_qty_type=strategy.percent_of_equity, default_qty_value=100, calc_on_order_fills=false, slippage=0, commission_type=strategy.commission.percent, commission_value=0.075)
strat_dir_input = input.string(title='Strategy Direction', defval='long', options=['long', 'short', 'all'])
strat_dir_value = strat_dir_input == 'long' ? strategy.direction.long : strat_dir_input == 'short' ? strategy.direction.short : strategy.direction.all
strategy.risk.allow_entry_in(strat_dir_value)
//INPUTS


length = input(21)
overSold = input(20)
overBought = input(80)
p = close

vrsi = ta.rsi(p, length)
price = close
var bool long = na
var bool short = na

long := ta.crossover(vrsi, overSold)
short := ta.crossunder(vrsi, overBought)

var float last_open_long = na
var float last_open_short = na

last_open_long := long ? close : nz(last_open_long[1])
last_open_short := short ? close : nz(last_open_short[1])
mpoint=(last_open_long+last_open_short)/2

entry_value = last_open_long
entry_value1 = last_open_short

// Rounding levels to min tick
nround(x) =>
    n = math.round(x / syminfo.mintick) * syminfo.mintick
    n
//
disp_panels = input(true, title='Display info panels?')
fibs_label_off = input(40, title='fibs label offset')
fibs_label_size = input.string(size.normal, options=[size.tiny, size.small, size.normal, size.large, size.huge], title='fibs label size')
r1_x = timenow + math.round(ta.change(time) * fibs_label_off)
r1_y = last_open_short
text1 = 'High : ' + str.tostring(nround(last_open_short))
s1_y = last_open_long
text3 = 'low : ' + str.tostring(nround(last_open_long))

R1_label = disp_panels ? label.new(x=r1_x, y=r1_y, text=text1, xloc=xloc.bar_time, yloc=yloc.price, color=color.orange, style=label.style_label_down, textcolor=color.black, size=fibs_label_size) : na
S1_label = disp_panels ? label.new(x=r1_x, y=s1_y, text=text3, xloc=xloc.bar_time, yloc=yloc.price, color=color.lime, style=label.style_label_up, textcolor=color.black, size=fibs_label_size) : na

label.delete(R1_label[1])
label.delete(S1_label[1])
//
plot(mpoint, title='avreage', color=color.new(color.red, 40), style=plot.style_linebr, linewidth=3, trackprice=true, offset=-9999)
plot(last_open_short, title='high', color=color.new(color.red, 40), style=plot.style_linebr, linewidth=3, trackprice=true, offset=-9999)
plot(last_open_long, title='low', color=color.new(color.blue, 40), style=plot.style_linebr, linewidth=3, trackprice=true, offset=-9999)
//
trend = input(false)
if barstate.islast and trend == true
    line z = line.new(bar_index[1], last_open_short[1], bar_index, last_open_short, extend=extend.both, color=color.red, style=line.style_dashed, width=1)
    line f = line.new(bar_index[1], mpoint[1], bar_index, mpoint, extend=extend.both, color=color.blue, style=line.style_dashed, width=1)
    line w = line.new(bar_index[1], last_open_long[1], bar_index, last_open_long, extend=extend.both, color=color.green, style=line.style_dashed, width=1)
    line.delete(z[1])
    line.delete(f[1])
    line.delete(w[1])

//bu = ta.crossover(close, mpoint)
//sz = ta.crossunder(close, mpoint)
//bu1 = ta.crossover(close, last_open_short)
sz1 = ta.crossunder(close, last_open_short)
bu2 = ta.crossover(close, last_open_long)
//sz2 = ta.crossunder(close, last_open_long)
//plotshape(sz, style=shape.triangledown, location=location.abovebar, color=color.new(color.orange, 0), size=size.tiny)
//plotshape(bu, style=shape.triangleup, location=location.belowbar, color=color.new(color.blue, 0), size=size.tiny)
//plotshape(sz1, style=shape.triangledown, location=location.abovebar, color=color.new(color.red, 0), size=size.tiny)
//plotshape(bu1, style=shape.triangleup, location=location.belowbar, color=color.new(color.green, 0), size=size.tiny)
//plotshape(sz2, style=shape.triangledown, location=location.abovebar, color=color.new(color.red, 0), size=size.tiny)
//plotshape(bu2, style=shape.triangleup, location=location.belowbar, color=color.new(color.green, 0), size=size.tiny)

l = bu2
s = sz1
if l
    strategy.entry('buy', strategy.long)
if s
    strategy.entry('sell', strategy.short)
per(pcnt) =>
    strategy.position_size != 0 ? math.round(pcnt / 100 * strategy.position_avg_price / syminfo.mintick) : float(na)
stoploss = input.float(title=' stop loss', defval=5, minval=0.01)
los = per(stoploss)
q1 = input.int(title=' qty_percent1', defval=50, minval=1)
q2 = input.int(title=' qty_percent2', defval=50, minval=1)
tp1 = input.float(title=' Take profit1', defval=3, minval=0.01)
tp2 = input.float(title=' Take profit2', defval=5, minval=0.01)
//tp4 = input.float(title=' Take profit4', defval=5, minval=0.01)
strategy.exit('x1', qty_percent=q1, profit=per(tp1), loss=los)
strategy.exit('x2', qty_percent=q2, profit=per(tp2), loss=los)