概述
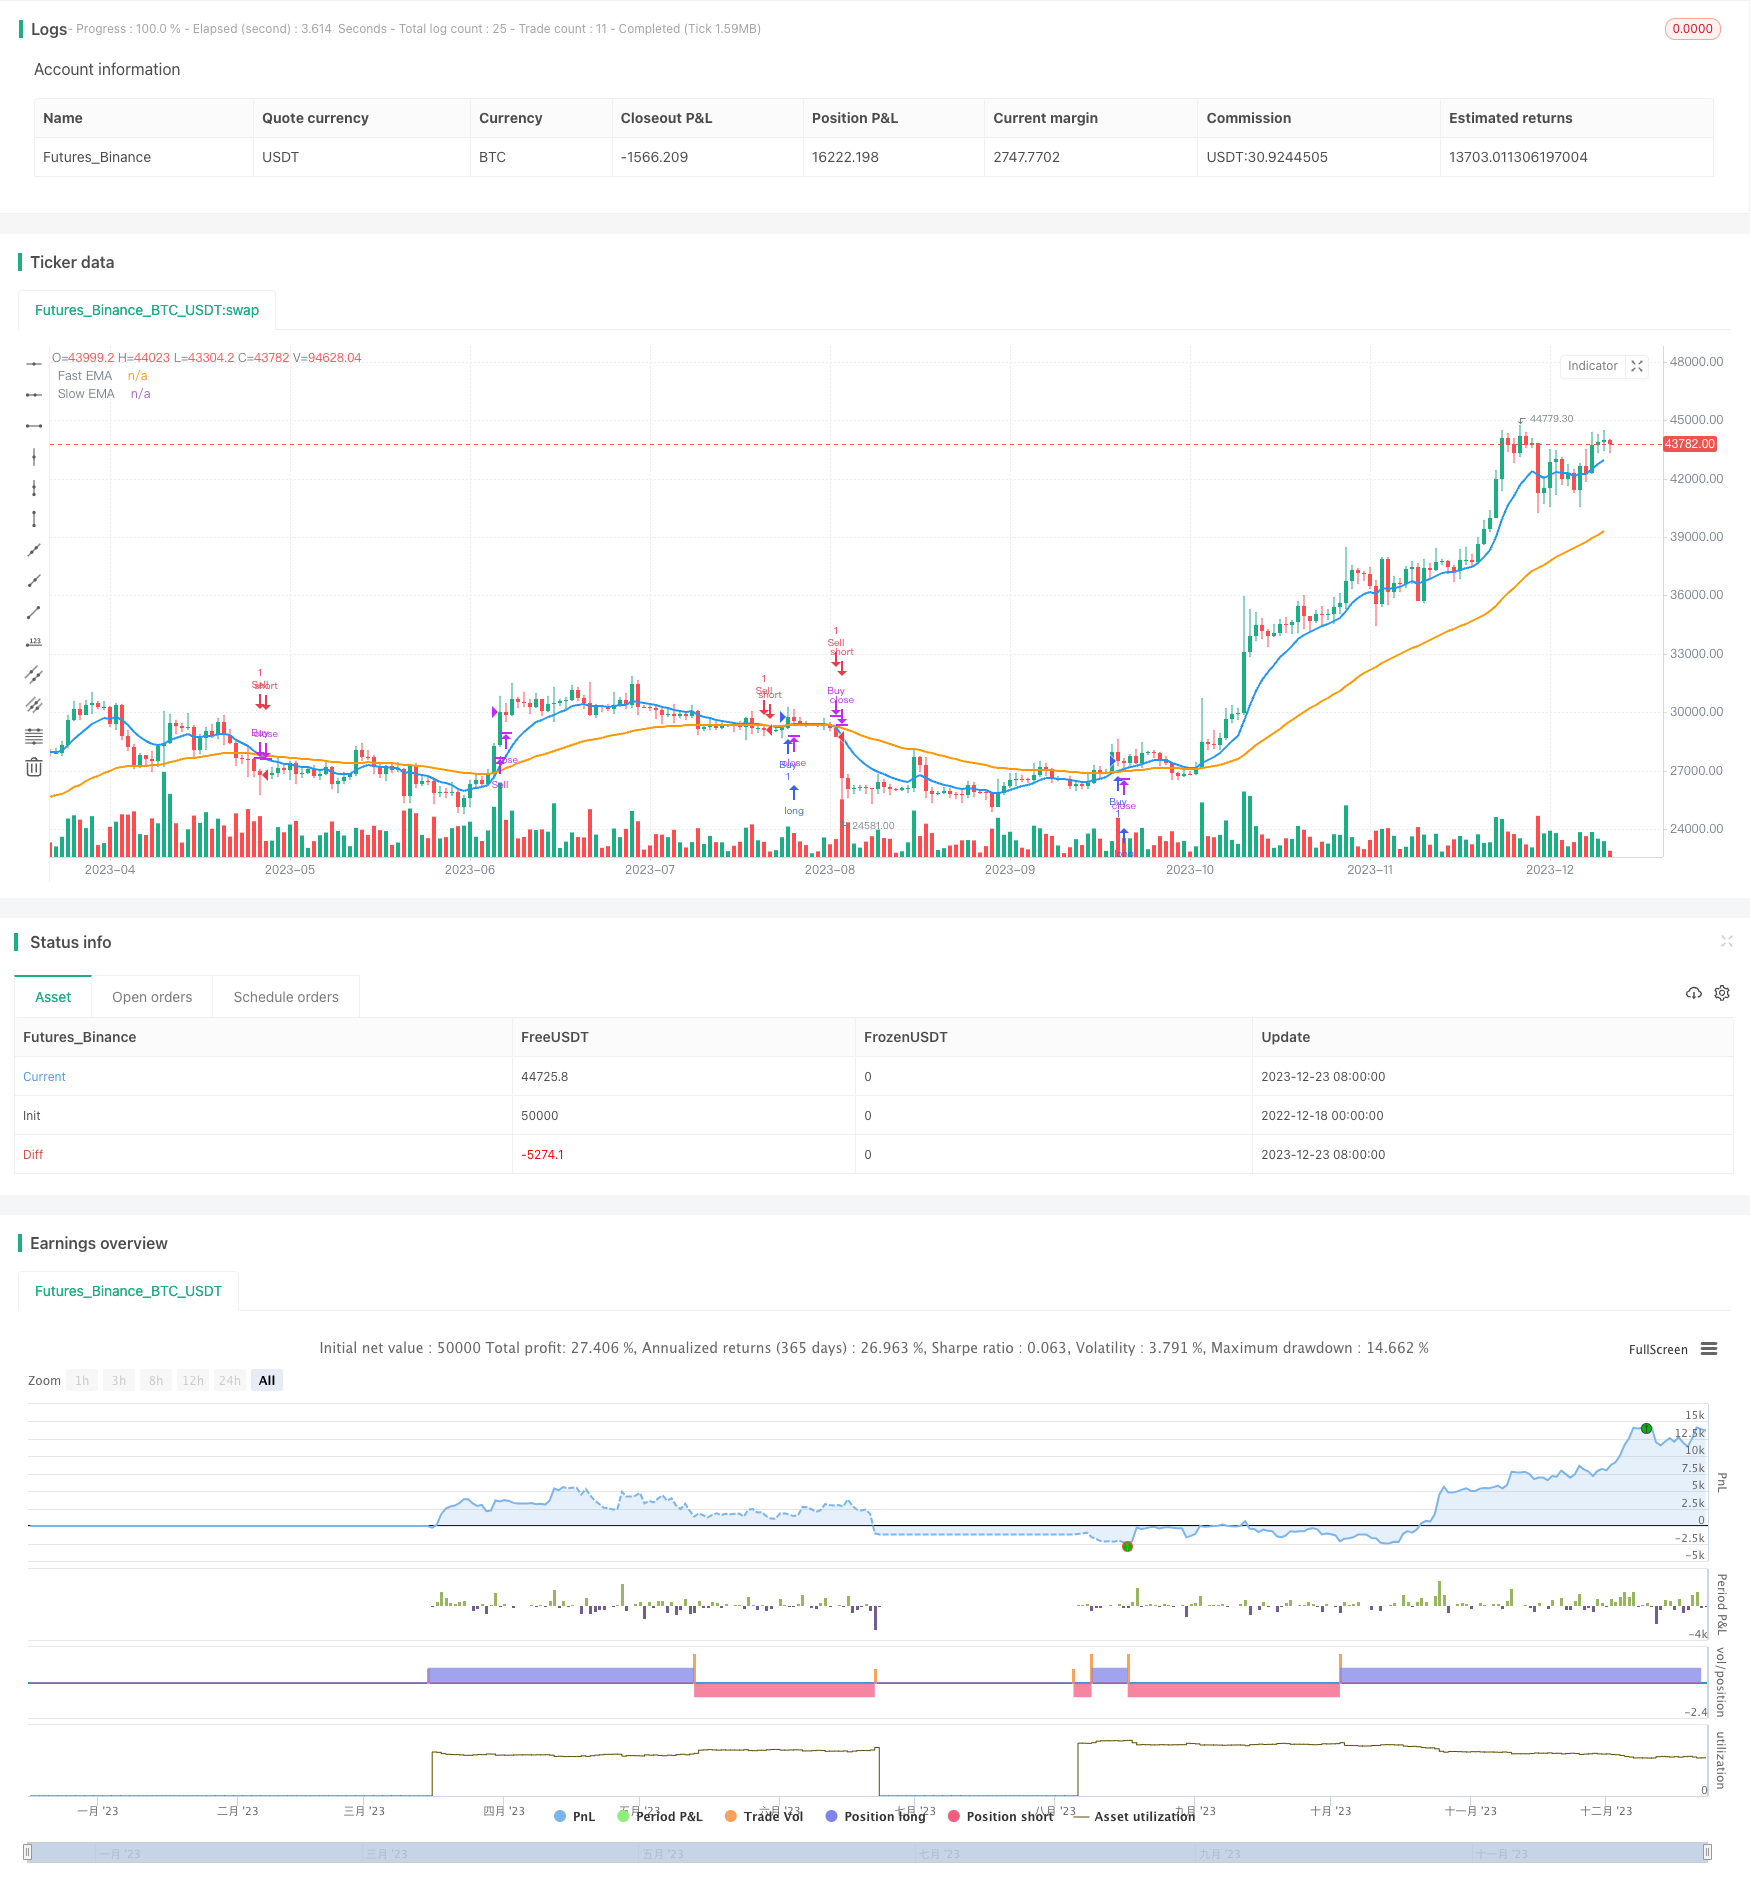
该策略通过计算快速EMA周期和慢速EMA周期的指数移动平均线,并绘制在图表上,实时监控其交叉情况,判断价格趋势的转向。结合RSI超买超卖指标避免虚假信号,形成交易信号。当快速EMA向上突破慢速EMA时产生买入信号;当快速EMA向下跌破慢速EMA时产生卖出信号。
策略原理
- 计算快速EMA周期和慢速EMA周期的指数移动平均线
- 绘制在图表上,实时监控交叉情况
- 快速EMA向上突破慢速EMA时判断为上升趋势,形成买入信号
- 快速EMA向下跌破慢速EMA时判断为下降趋势,形成卖出信号
- 结合RSI指标避免虚假信号
- 设置趋势过滤条件,只在趋势变化时交易
优势分析
- 使用EMA判断趋势转向,对小范围波动不敏感
- RSI指标过滤可避免反转虚假信号
- 可自定义EMA周期和RSI参数,适应不同市场
- 代码直观简洁,容易理解实现
风险分析
- EMA具有滞后性,可能错过转折点
- 大幅震荡市场中EMA判断失效
- 需要适当调整EMA参数和RSI参数
- 可结合其他指标验证信号
优化方向
- 结合其他指标验证信号确定度
- 增加止损策略控制风险
- 测试不同周期参数的稳定性
- 增加货币强度指标避免货币风险
- 考虑交易成本优化获利比
总结
该策略整体思路清晰,使用EMA判断趋势转向,结合RSI指标过滤信号,可以有效捕捉中长线趋势。但EMA和RSI参数的调整及止损策略仍需优化,且面临错过反转点和震荡市的风险。如果参数优化和风险控制到位,该策略可以用于发现中长线趋势转折点,制定投资决策。
策略源码
/*backtest
start: 2022-12-18 00:00:00
end: 2023-12-24 00:00:00
period: 1d
basePeriod: 1h
exchanges: [{"eid":"Futures_Binance","currency":"BTC_USDT"}]
*/

//@version=5
strategy("Trend Change with EMA Entry/Exit - Intraday", overlay=true)

// Define the fast and slow EMA periods
fast_ema_period = input(10, title="Fast EMA Period")
slow_ema_period = input(50, title="Slow EMA Period")

// Calculate the EMAs
ema_fast = ta.ema(close, fast_ema_period)
ema_slow = ta.ema(close, slow_ema_period)

// Plot the EMAs on the chart
plot(ema_fast, title="Fast EMA", color=color.blue, linewidth=2)
plot(ema_slow, title="Slow EMA", color=color.orange, linewidth=2)

// Detect trend changes (crossovers and crossunders)
is_uptrend = ta.crossover(ema_fast, ema_slow)
is_downtrend = ta.crossunder(ema_fast, ema_slow)

// Relative Strength Index (RSI)
rsi_length = input(14, title="RSI Length")
overbought_level = input(70, title="Overbought Level")
oversold_level = input(30, title="Oversold Level")
rsi_value = ta.rsi(close, rsi_length)

// Trend Filter
is_trending = ta.change(is_uptrend) != 0 or ta.change(is_downtrend) != 0

// Entry and Exit signals
enter_long = is_uptrend and rsi_value < overbought_level and is_trending
exit_long = is_downtrend and is_trending
enter_short = is_downtrend and rsi_value > oversold_level and is_trending
exit_short = is_uptrend and is_trending

strategy.entry("Buy", strategy.long, when=enter_long)
strategy.close("Buy", when=exit_long)
strategy.entry("Sell", strategy.short, when=enter_short)
strategy.close("Sell", when=exit_short)