资源加载中... loading...

Dual Moving Average Crossover Strategy

Author: ChaoZhang, Date: 2023-12-25 15:15:46
Tags:

img

Overview

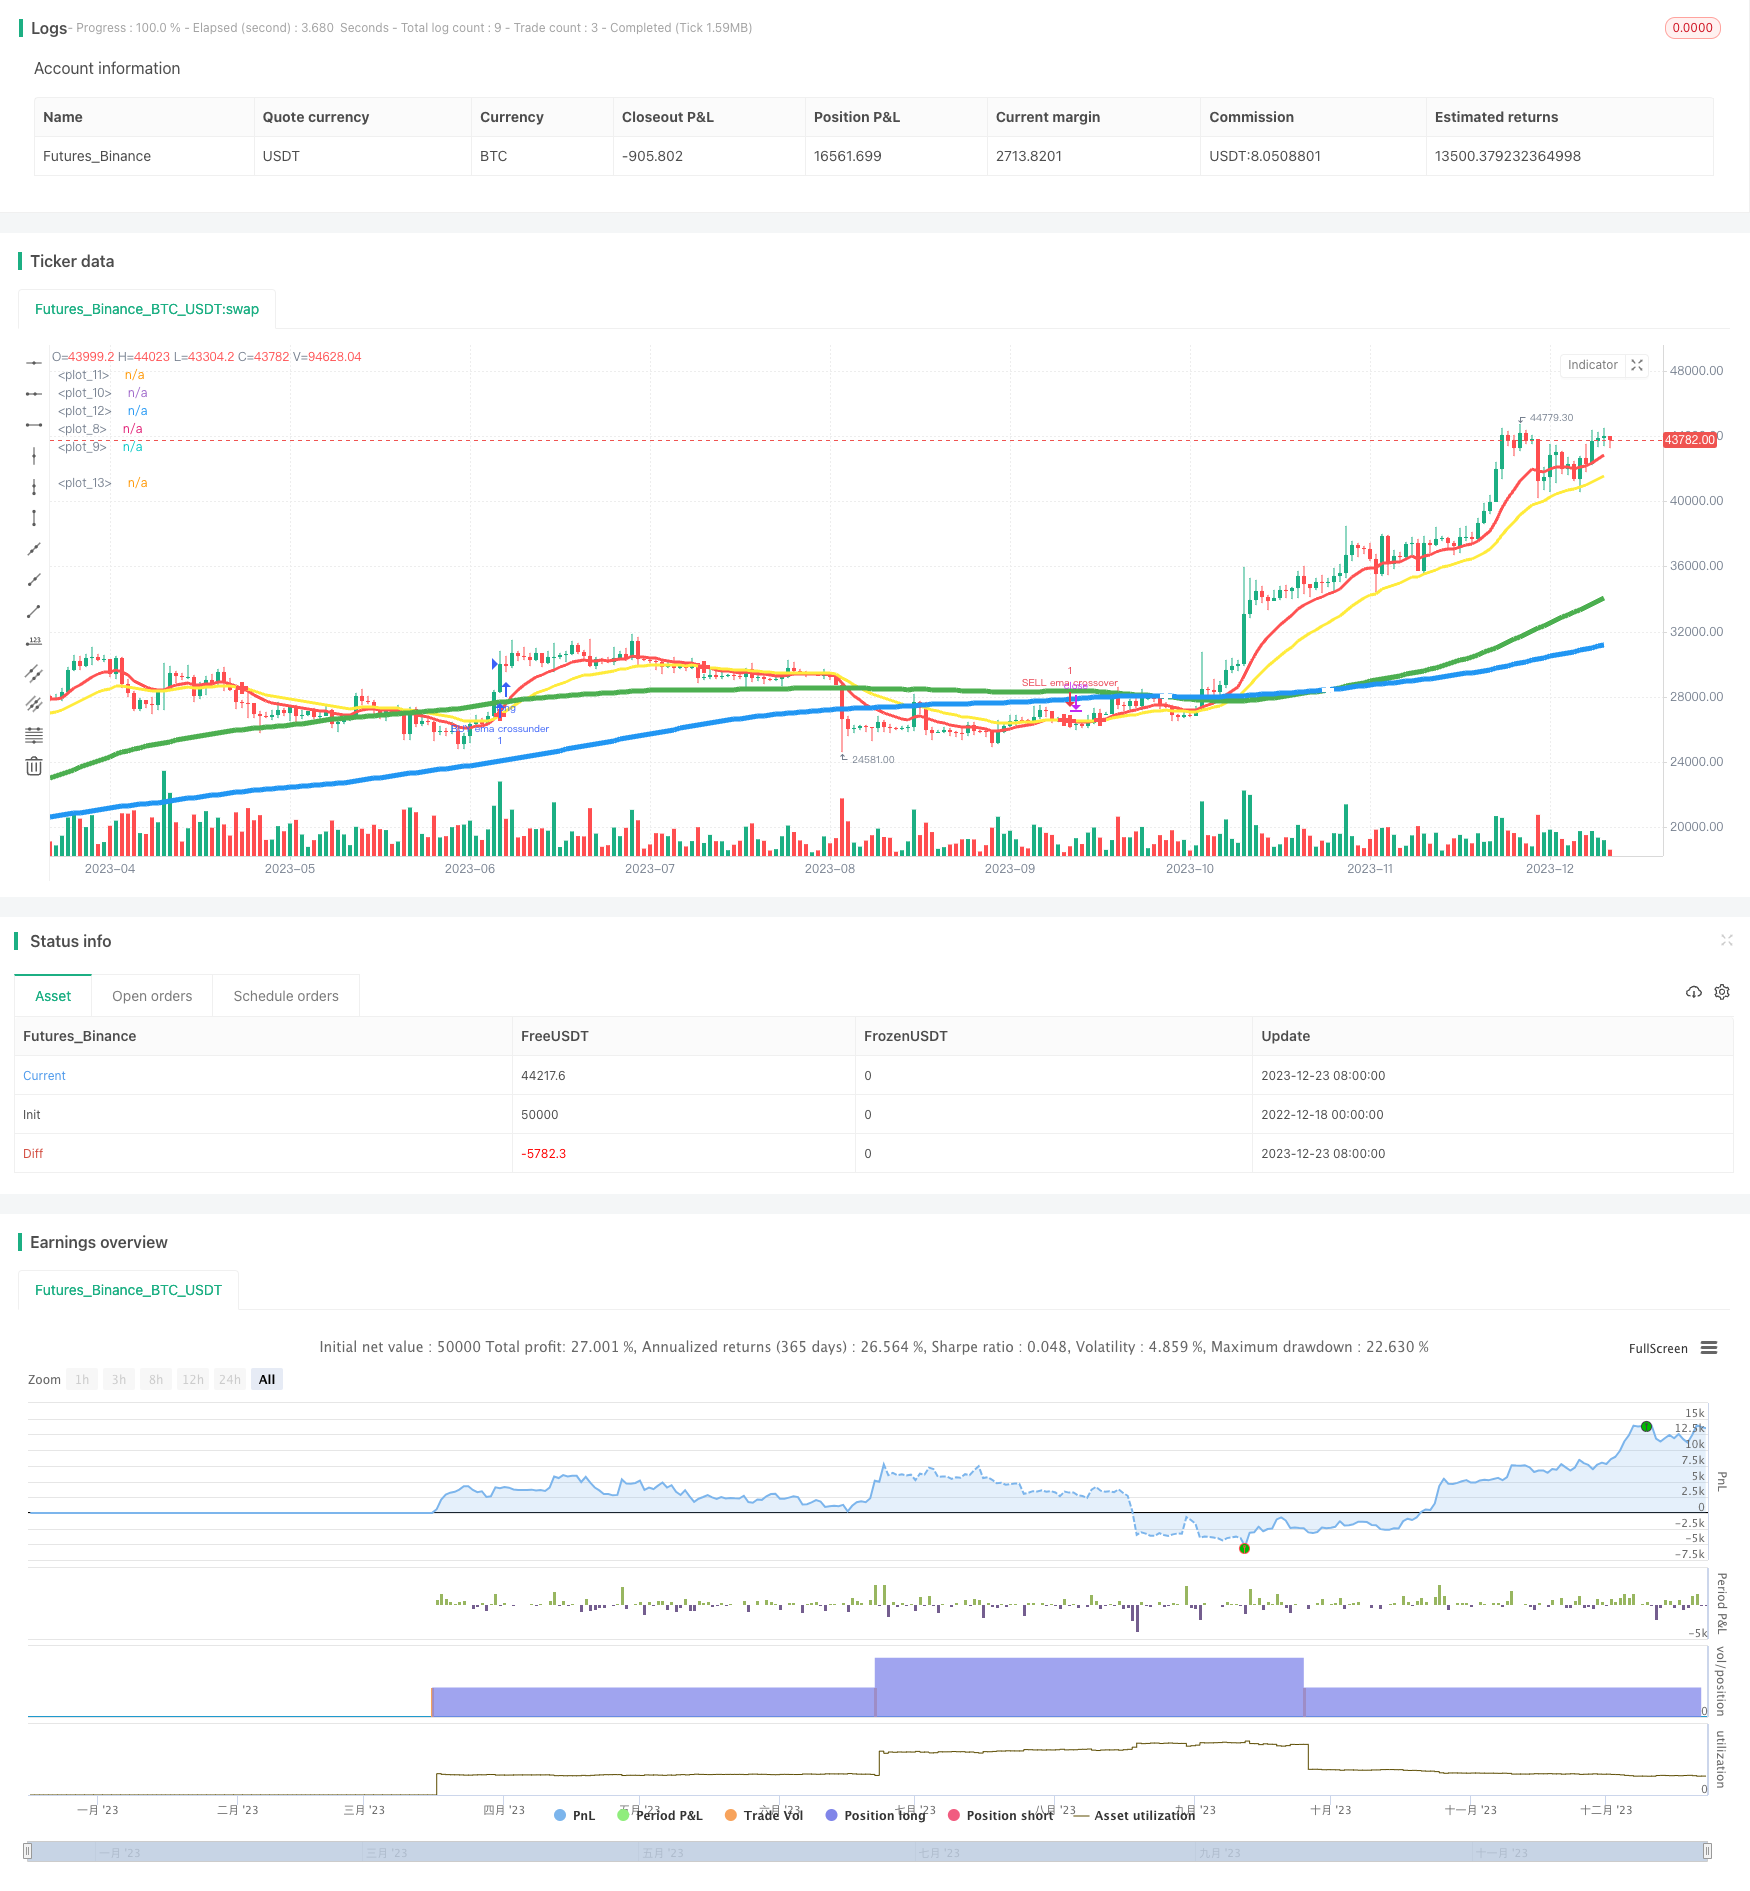
This strategy utilizes the golden crossover principle of dual moving averages, combined with the RSI indicator to determine entry and exit points. The strategy mainly judges the crossover situations between the 26-period EMA and 12-period EMA, as well as the 100-period SMA and 200-period SMA, and issues trading signals when crossovers happen while also checking the RSI indicator.

Strategy Principles

The strategy is primarily based on the crossover principles of dual moving averages. Among the dual moving averages, the 26-period EMA represents short-term trends, while the 12-period EMA represents even shorter-term price fluctuations. When the shorter-term EMA crosses above the longer-term EMA, it signals prices turning from decline to incline, indicating long signals. When the shorter-term EMA crosses below the longer-term one, it signals prices turning from incline to decline, indicating short signals. The strategy also incorporates the 100-period SMA and 200-period SMA to determine medium-to-long term and long-term trends based on their crossover situations.

Along with determining the EMA and SMA crossovers, the strategy also incorporates the RSI indicator to issue trading signals. The RSI helps determine whether prices are overbought or oversold. RSI above 70 indicates an overbought signal, while RSI below 30 indicates an oversold signal. Therefore, the strategy checks the RSI when EMA or SMA crossovers occur to avoid issuing incorrect trading signals when prices are at extreme overbought or oversold levels.

Advantages

  1. Using dual EMAs to determine short-term price moves and dual SMAs for medium-to-long term moves can effectively detect price turning points.

  2. Incorporating the RSI indicator helps avoid incorrect signals when prices are overbought or oversold.

  3. EMA, SMA parameters can be adjusted to suit different timeframes and trading instruments.

  4. Simple and clear strategy logic makes it easy to understand and optimize.

Risks

  1. Both moving averages have lagging effects, unable to predict price turning points prematurely.

  2. Inappropriate EMA, SMA parameter settings may generate excessive false signals.

  3. RSI may also fail in certain cases, become unable to effectively determine overbought/oversold prices.

  4. Parameters need adjustments for different trading instruments, lacking versatility.

Solutions

  1. Incorporate other leading indicators to determine price moves and potential turning points.

  2. Test parameter stability, select parameter sets with highest win rates.

  3. Incorporate other indicators like KD, BOLL to avoid RSI failure cases.

  4. Test parameters respectively based on different trading instruments, save parameter templates.

Optimization Directions

  1. Test EMA, SMA parameter combinations for optimal sets.

  2. Add other indicators to form combination strategies, commonly KD, MACD etc.

  3. Add stop loss/take profit strategies with reasonable ratios.

  4. Optimize entry timing, avoid entering when price fluctuates greatly. Set price fluctuation threshold values.

  5. Distinguish bull/bear market conditions, set different trading signal criteria.

Conclusion

This strategy mainly utilizes the crossover principles of dual moving averages to issue trading signals, which is simple and practical, easy to optimize. But it has certain lagging effects in predicting price turning points, and may fail in certain markets. Its stability and win rate can be improved via parameter optimization and indicator combinations. Overall speaking, the strategy suits medium-to-long term trend trading, and can be incorporated into other strategies, thus having certain practical values.


/*backtest
start: 2022-12-18 00:00:00
end: 2023-12-24 00:00:00
period: 1d
basePeriod: 1h
exchanges: [{"eid":"Futures_Binance","currency":"BTC_USDT"}]
*/

//@version=2
strategy(shorttitle = "Gamma pips EMA Cross", title="MA Cross", overlay=true)
s100sma = sma(close, 100)
s200sma = sma(close, 200)
s26ema = ema(close,26)
s12ema = ema(close,12)

plot(s100sma, color = green, linewidth = 5)
plot(s200sma, color = blue, linewidth = 5)
plot(s26ema, color = yellow, linewidth = 3)
plot(s12ema, color = red, linewidth = 3)
EMACross = plot(cross(s26ema, s12ema) ? s26ema : na, style = cross, linewidth = 5, color = red)
SMACross = plot(cross(s100sma, s200sma) ? s200sma : na, style = cross, linewidth = 5, color = white)
Alert = cross(s26ema, s12ema)
alertcondition(Alert, title="EMA Crossing")

//============ signal Generator ==================================//
EMACrossover = crossover(s26ema, s12ema) //if yellow cross and is above red ->SELL
EMACrossunder = crossunder(s26ema, s12ema) //if yellow cross and is below red ->BUY
SMACrossover = crossover(s100sma, s200sma) //green crosses above blue ->Buy
SMACrossunder = crossunder (s100sma, s200sma) //green crosses below below ->Sell
price = close
BuyCondition = (EMACrossunder) and (price >= s100sma)
SellCondition = (EMACrossover) and (price <= s100sma)

///---------Buy Signal-------------///
if (BuyCondition)
    strategy.order("BUY ema crossunder", strategy.long)

 
///Short signal------//
if(SellCondition)
    strategy.order("SELL ema crossover", strategy.short)


template: strategy.tpl:40:21: executing "strategy.tpl" at <.api.GetStrategyListByName>: wrong number of args for GetStrategyListByName: want 7 got 6