概述
双均线追踪策略是一种基于均线指标的量化交易策略。该策略主要利用了移动平均线的黄金交叉和死亡交叉来发出买入和卖出信号。当短期移动平均线从下方上穿较长周期的移动平均线时,产生黄金交叉信号;当短期移动平均线从上方下穿较长周期的移动平均线时,产生死亡交叉信号。本策略同时结合RSI指标和ADX指标来确定趋势的方向和力度,在趋势较强时选择入场。
策略原理
该策略主要基于三个技术指标:
超越指标(Supertrend):用于判断价格的主要趋势方向。当Supertrend指标方向变化时,判断为价格趋势转折点,发出交易信号。
RSI指标(Relative Strength Index):一种震荡指标,用于判断超买超卖情况。本策略在RSI指标显示价格短期超买或超卖时发出交易信号。
ADX指标(Average Directional Indicator):用于判断趋势的力度。本策略结合ADX判断趋势力度,在趋势较强时选择入场。
当Supertrend指标方向变化,表示价格趋势发生转折;同时RSI指标显示超买超卖现象,表明短期需求供应关系发生转变,价格可能反转;此外,ADX指标显示趋势力度较大,这就为本策略的入场提供了机会。具体来说,当出现Supertrend方向变化,RSI指标显示超卖,且ADX>20时,发出做多信号;当Supertrend方向变化,RSI指标显示超买,发出平仓信号。
策略优势
使用双均线系统,能够有效跟踪价格趋势的变化,Profit从趋势中获利。
结合RSI指标判断超买超卖现象,避免在价格转折点追高杀低。
ADX指标判断趋势力度,使得本策略主要在趋势较强时出手,从大趋势中获利。
策略参数经过优化选择,对比测试表现良好。
风险与解决
双均线策略本身对价格变化较为敏感,可能产生较多的交易信号。解决方法是适当调整均线参数,缩小交易频率。
RSI指标和ADX指标都可能出现失效的情况。解决方法是进行参数优化,调整指标计算周期。
本策略需选择合适的止损策略。解决方法是设置合理的移动止损或挂单止损。
策略优化方向
对交易频率进行优化。可以尝试优化均线系统参数,调整交易频率。
可以引入其他辅助指标。比如引入交易量指标,在大单进场时选择入场。
可以结合机器学习算法进行参数优化。使用算法预测最优参数组合。
引入止损机制。设置移动止损或者挂单止损来控制单笔损失。
总结
本策略是一种双均线追踪策略,核心思路是跟踪均线指标判断价格趋势,并结合RSI指标和ADX指标选择入场时机。其优势在于能顺应趋势运行,在超买超卖现象出现时机敏锐入场,从大趋势中获利。该策略风险主要来自于价格变化敏感性大,可能产生过于频繁交易。通过参数优化与止损手段,可以有效调整该策略,使其在实盘中获得更好表现。
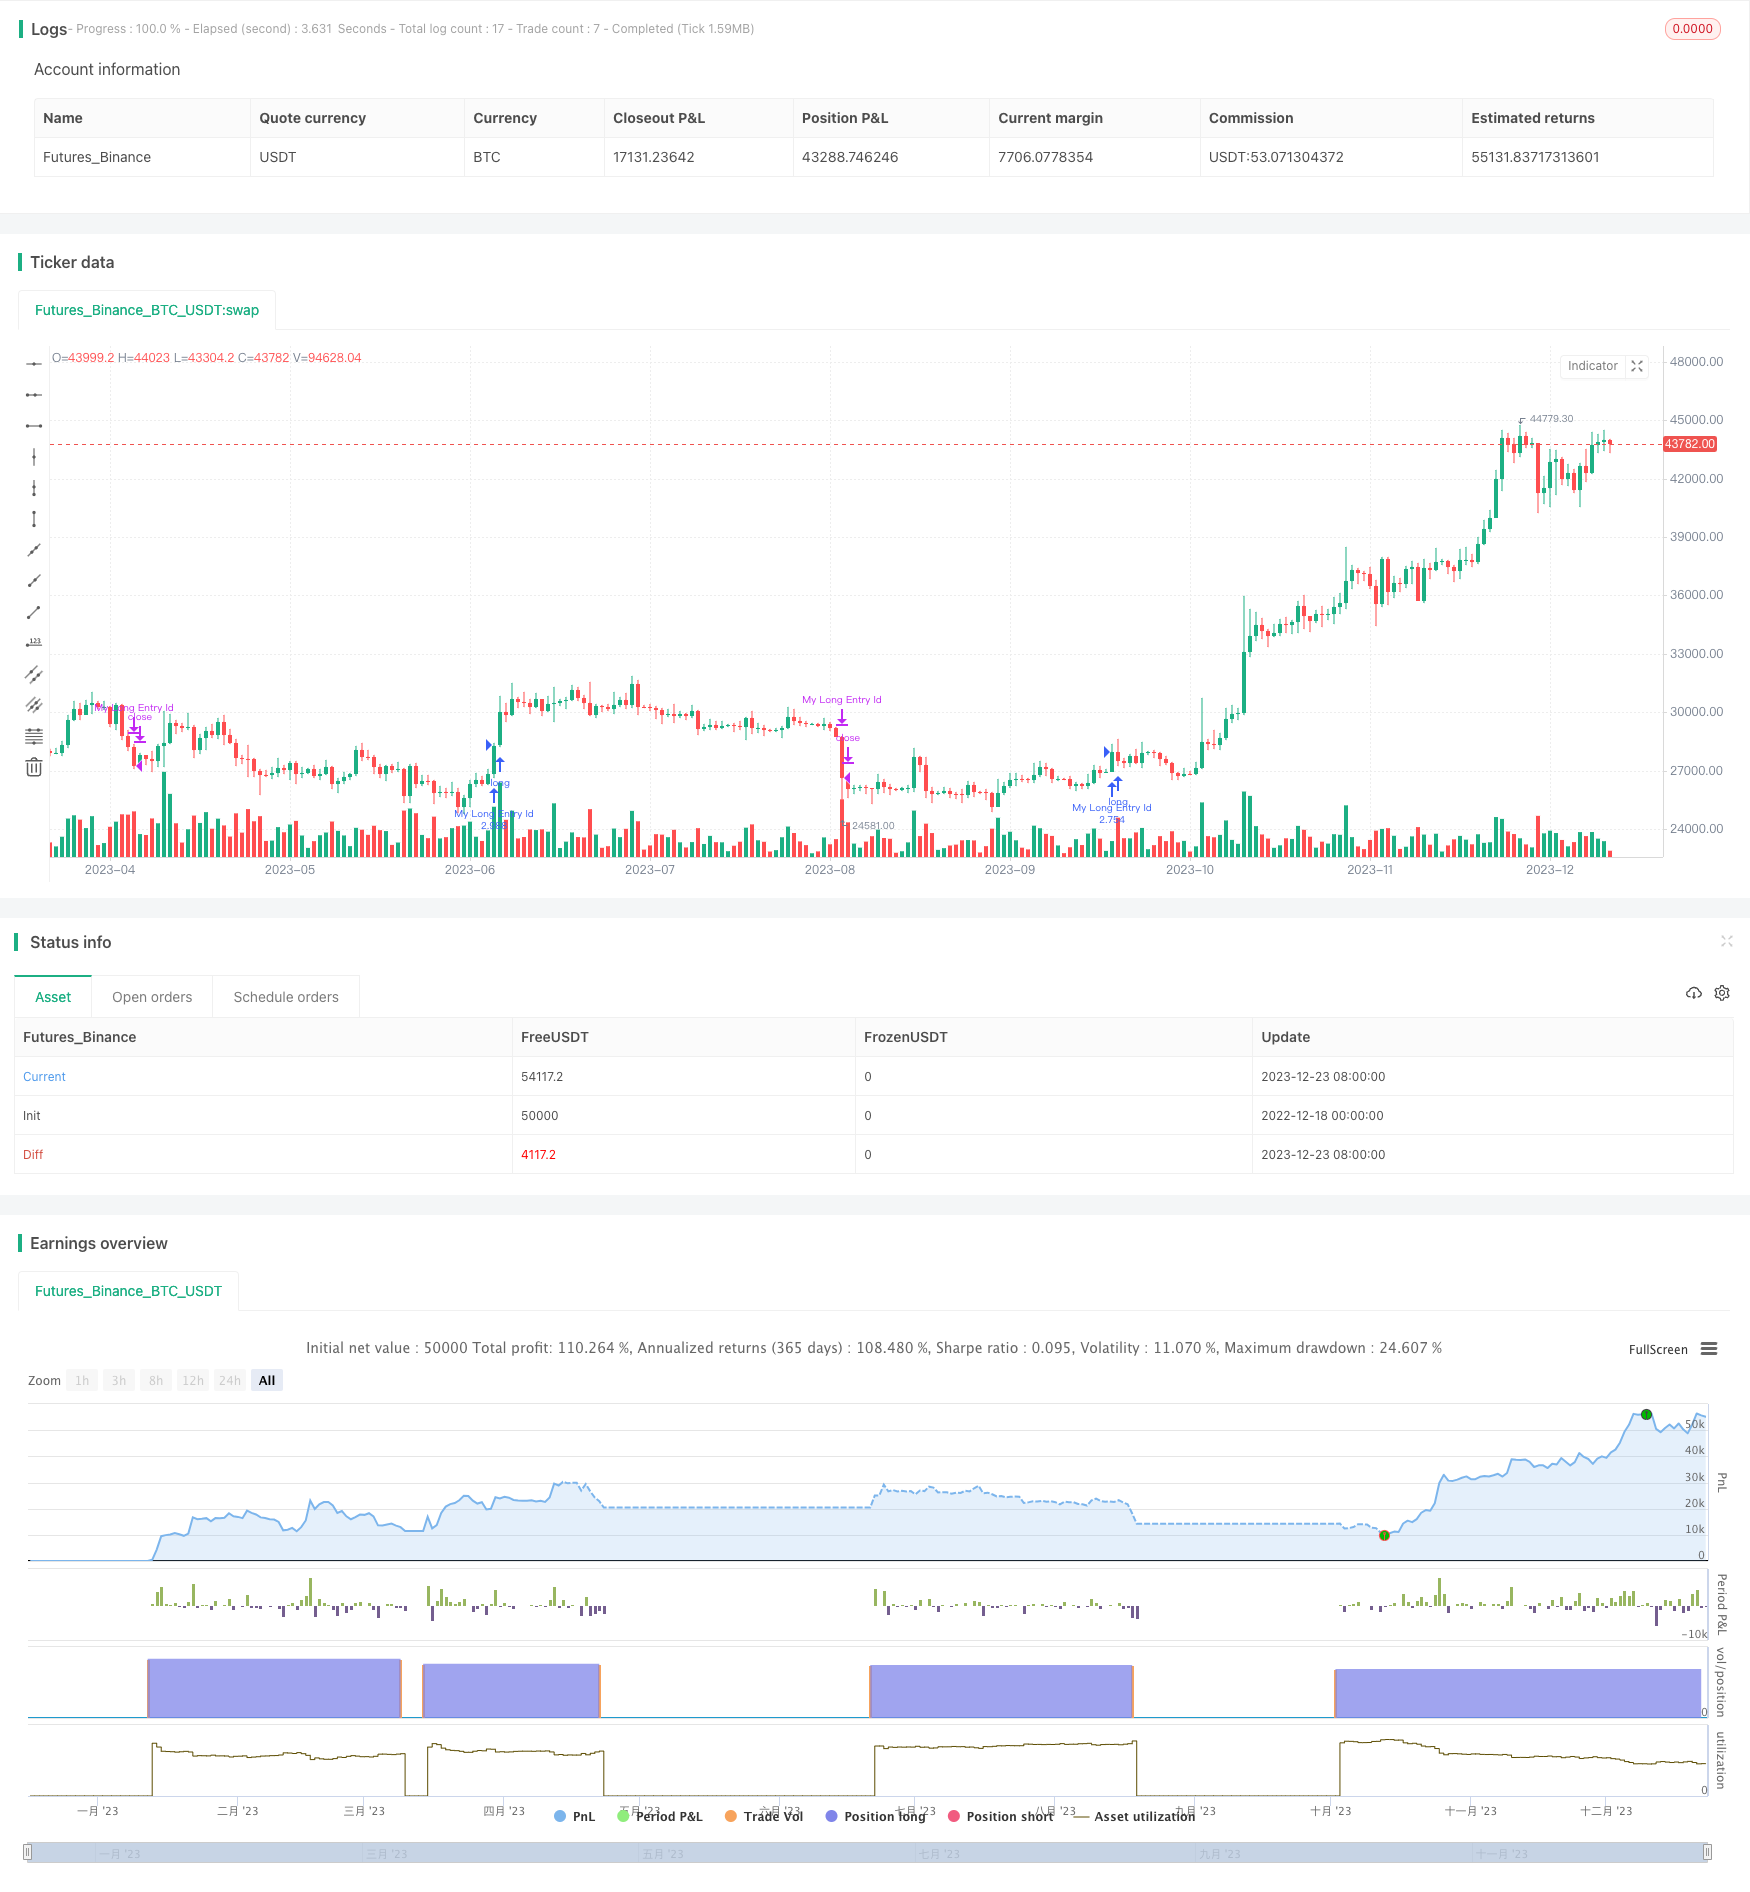
/*backtest
start: 2022-12-18 00:00:00
end: 2023-12-24 00:00:00
period: 1d
basePeriod: 1h
exchanges: [{"eid":"Futures_Binance","currency":"BTC_USDT"}]
*/

//@version=5
strategy("Supertrend Strategy", overlay=true, default_qty_type=strategy.percent_of_equity, default_qty_value=120,
     initial_capital=1000, margin_long=0.1)

atrPeriod = input(10, "ATR Length")
factor = input.float(3.0, "Factor", step=0.01)

[_, direction] = ta.supertrend(factor, atrPeriod)

adxlen = input(7, title="ADX Smoothing")
dilen = input(7, title="DI Length")
dirmov(len) =>
	up = ta.change(high)
	down = -ta.change(low)
	plusDM = na(up) ? na : (up > down and up > 0 ? up : 0)
	minusDM = na(down) ? na : (down > up and down > 0 ? down : 0)
	truerange = ta.rma(ta.tr, len)
	plus = fixnan(100 * ta.rma(plusDM, len) / truerange)
	minus = fixnan(100 * ta.rma(minusDM, len) / truerange)
	[plus, minus]
adx(dilen, adxlen) =>
	[plus, minus] = dirmov(dilen)
	sum = plus + minus
	adx = 100 * ta.rma(math.abs(plus - minus) / (sum == 0 ? 1 : sum), adxlen)
sig = adx(dilen, adxlen)

if ta.change(direction) < 0 and ta.rsi(close, 21) < 66 and ta.rsi(close, 3) > 80 and ta.rsi(close, 28) > 49 and sig > 20
    strategy.entry("My Long Entry Id", strategy.long)

if ta.change(direction) > 0
    strategy.close("My Long Entry Id")  // Close long position

//plot(strategy.equity, title="equity", color=color.red, linewidth=2, style=plot.style_areabr)