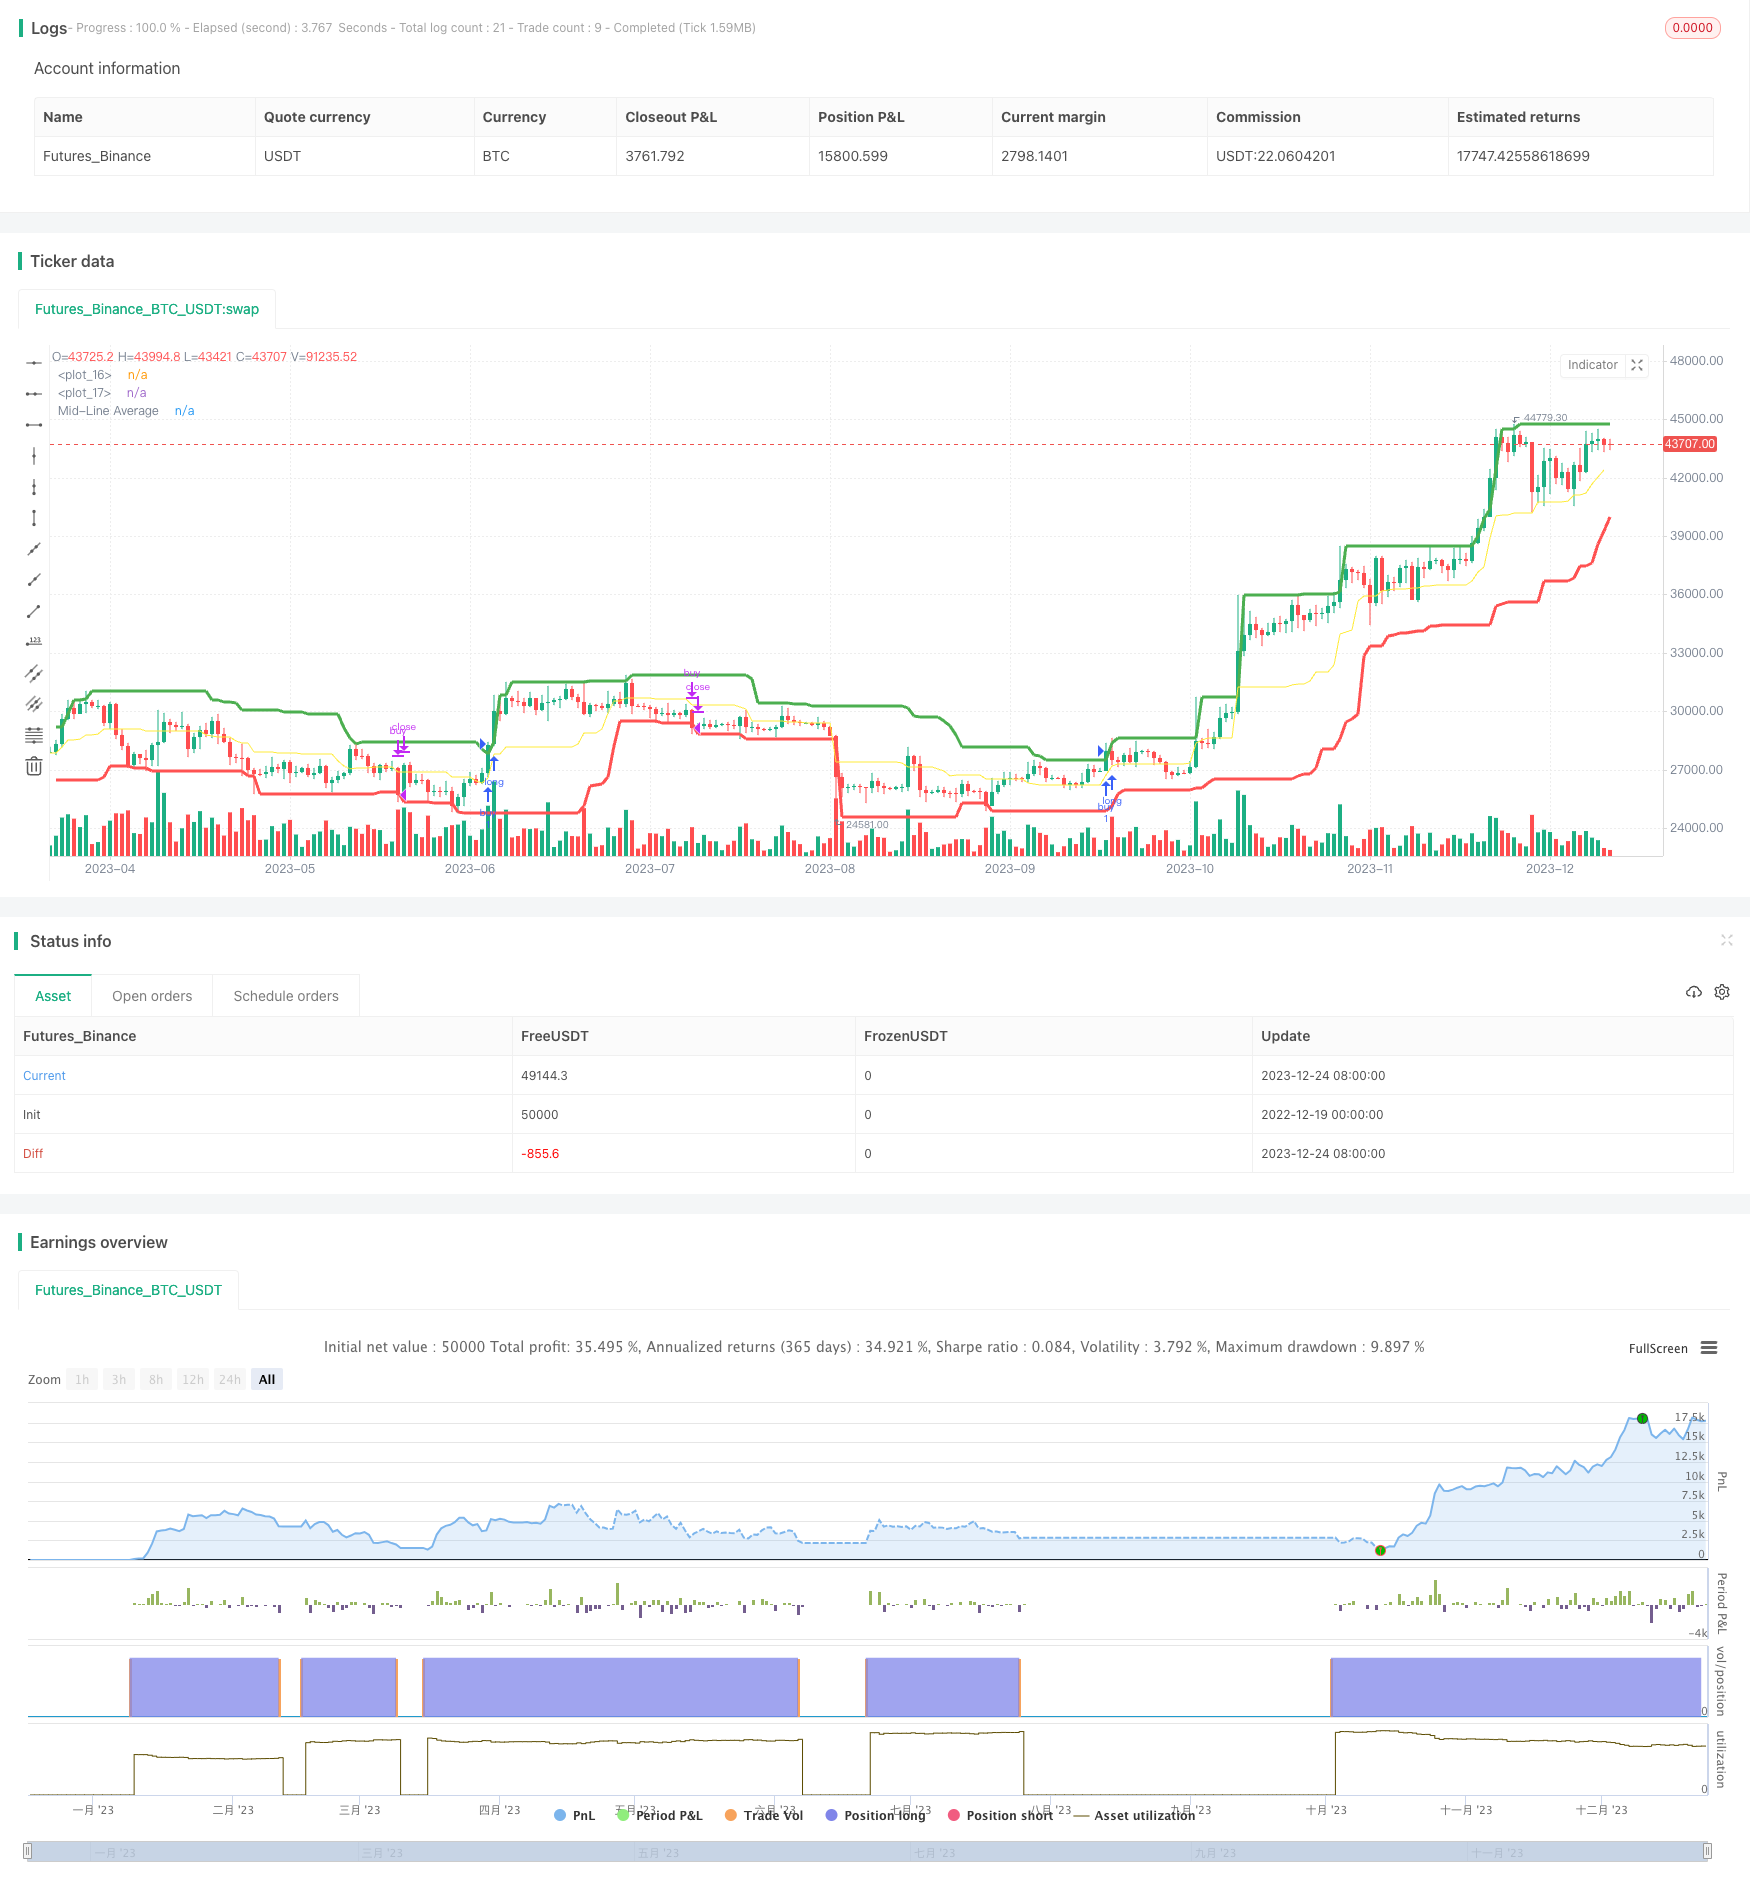
本策略基于唐奇安通道指标,实现买入上轨突破和卖出下轨突破的交易策略。
策略原理
策略通过计算不同参数的上轨和下轨,分别实现买入和卖出信号。
上轨计算公式:上轨 = 最高值(长度1) 下轨计算公式:下轨 = 最低值(长度2) 中轴计算公式:中轴 = (上轨 + 下轨)/ 2
当收盘价超过上轨时,产生买入信号;当收盘价低于下轨时,产生卖出信号。
该策略的优点是可以通过调整上轨和下轨的参数,实现更灵活的交易规则。
策略优势
可以自定义上下轨参数,使买入和卖出规则可以独立控制,更加灵活。
通过中轴指标衡量上下轨平均位置,可以更清晰判断价格突破。
唐奇安通道具有趋势跟踪性能,可以有效捕捉趋势机会。
策略操作简单,容易实施。
策略风险
容易产生虚假突破,需要结合其他指标过滤。
无法判断趋势背驰,需要人工或其他指标结合。
上下轨参数设置不当可能导致过于激进或保守,需要注意参数调整。
策略优化方向
可以考虑结合移动平均线等指标过滤虚假突破。
可以结合波动率指标判断真实突破概率。
可以动态调整上下轨参数,实现自适应交易规则。
总结
本策略通过双轨道唐奇安通道实现灵活的突破操作。策略简单易操作,但存在一定虚假突破概率。可以通过参数优化及結合其他指标进行过滤,从而改进策略效果。
策略源码
/*backtest
start: 2022-12-19 00:00:00
end: 2023-12-25 00:00:00
period: 1d
basePeriod: 1h
exchanges: [{"eid":"Futures_Binance","currency":"BTC_USDT"}]
*/

//@version=3
//Modified Donchian Channel with separate adjustments for upper and lower levels, with offset
// Strategy to buy on break upper Donchian and sell on lower Donchian
strategy("Donchian Backtest", overlay=true)

length1 = input(20, minval=1, title="Upper Channel")
length2 = input(20, minval=1, title="Lower Channel")
offset_bar = input(0,minval=0, title ="Offset Bars")
max_length = max(length1,length2)

upper = highest(length1)
lower = lowest(length2)

basis = avg(upper, lower)

l = plot(lower, style=line, linewidth=3, color=red, offset=1)
u = plot(upper, style=line, linewidth=3, color=green, offset=1)

plot(basis, color=yellow, style=line, linewidth=1, title="Mid-Line Average")
//break upper Donchian (with 1 candle offset) (buy signal)
break_up = (close >= upper[1])
//break lower Donchian (with 1 candle offset) (sell signal)
break_down = (close <= lower[1])


if break_up
    strategy.entry("buy", strategy.long,1)
if break_down
    strategy.close("buy")

//plot(strategy.equity)