概述
该策略综合利用了超趋势指标和MACD指标的潜在趋势反转信号,配合RSI指标的超买超卖信号,形成了一个较为稳定和高效的开仓及平仓信号体系。策略名称为“超趋势MACD量化策略”。
策略原理
该策略的核心逻辑在于综合利用超趋势指标和MACD指标作为开仓信号的判定标准。
超趋势部分,策略采用超趋势指标的方向改变作为潜在反转信号。当超趋势指标方向从上转向下时产生买入信号;当超趋势指标方向从下转向上时产生卖出信号。
MACD部分,策略采用MACD指标在较低时间框架(日线)上的斜率和零轴交叉来判断潜在反转机会。当MACD斜率绝对值较大(大于阈值)且斜率保持同向上升时产生信号;如果MACD指标交叉零轴时也会产生辅助信号。MACD部分信号较超趋势部分更加平滑。
在开仓信号上,策略要求超趋势信号和MACD信号保持一致方向才会发出开仓指令。
此外,在平仓部分策略还引入了RSI指标的超买超卖信号。当RSI指标大于80时产生卖出信号,小于20时产生买入信号,来辅助判断反转时机。
优势分析
该策略最大的优势在于指标信号的多样性。不同指标之间可以形成互补,使整体信号更加平稳和可靠。
超趋势指标的反转信号可以捕捉比较有力的短期趋势;MACD斜率可以判断中长期趋势力度,避免被假反转误导;而RSI则可以在区间震荡行情中提示超买超卖的最佳开仓和平仓时机。多个指标信号的叠加,可以过滤掉一些噪声交易,取得更高的胜率。
此外,策略的时间框架设定也较为合理。超趋势采用小时级时间框架, MACD指标采用日线,这样既保证了交易频率,也兼顾了趋势判断的稳定性。
风险分析
该策略的主要风险在于指标之间产生混淆信号的概率较大。比如超趋势产生假反转,而MACD信号并未同步产生。这时就可能导致不必要的亏损。
此外,RSI指标用于判断平仓的时机也可能会过早或过晚,使得策略的持仓时间无法获得最大化。
最后,MACD指标的斜率阈值设置过大也会导致错过较弱的反转机会。
优化方向
该策略可以从以下几个方面进行进一步优化:
引入止损机制。当亏损超过一定比例时止损。
对MACD斜率的判断加入动态阈值。当市场波动较大时提高斜率阈值,市场稳定时降低阈值。
对于RSI指标平仓判断加入回调条件。即RSI超过80后要求有一次明显回调再考虑平仓。
Testing MACD with volume and see if it improves signal reliability
Trying automated parameter tuning to find optimal settings
总结
“超趋势MACD量化策略”综合多个指标提供开仓和平仓信号。其优点是信号稳定,胜率较高,通过参数优化还可进一步提升。风险和优化方向也主要集中在参数设定 overfitting 的问题上。整体而言,该策略具有很强的实战应用价值。
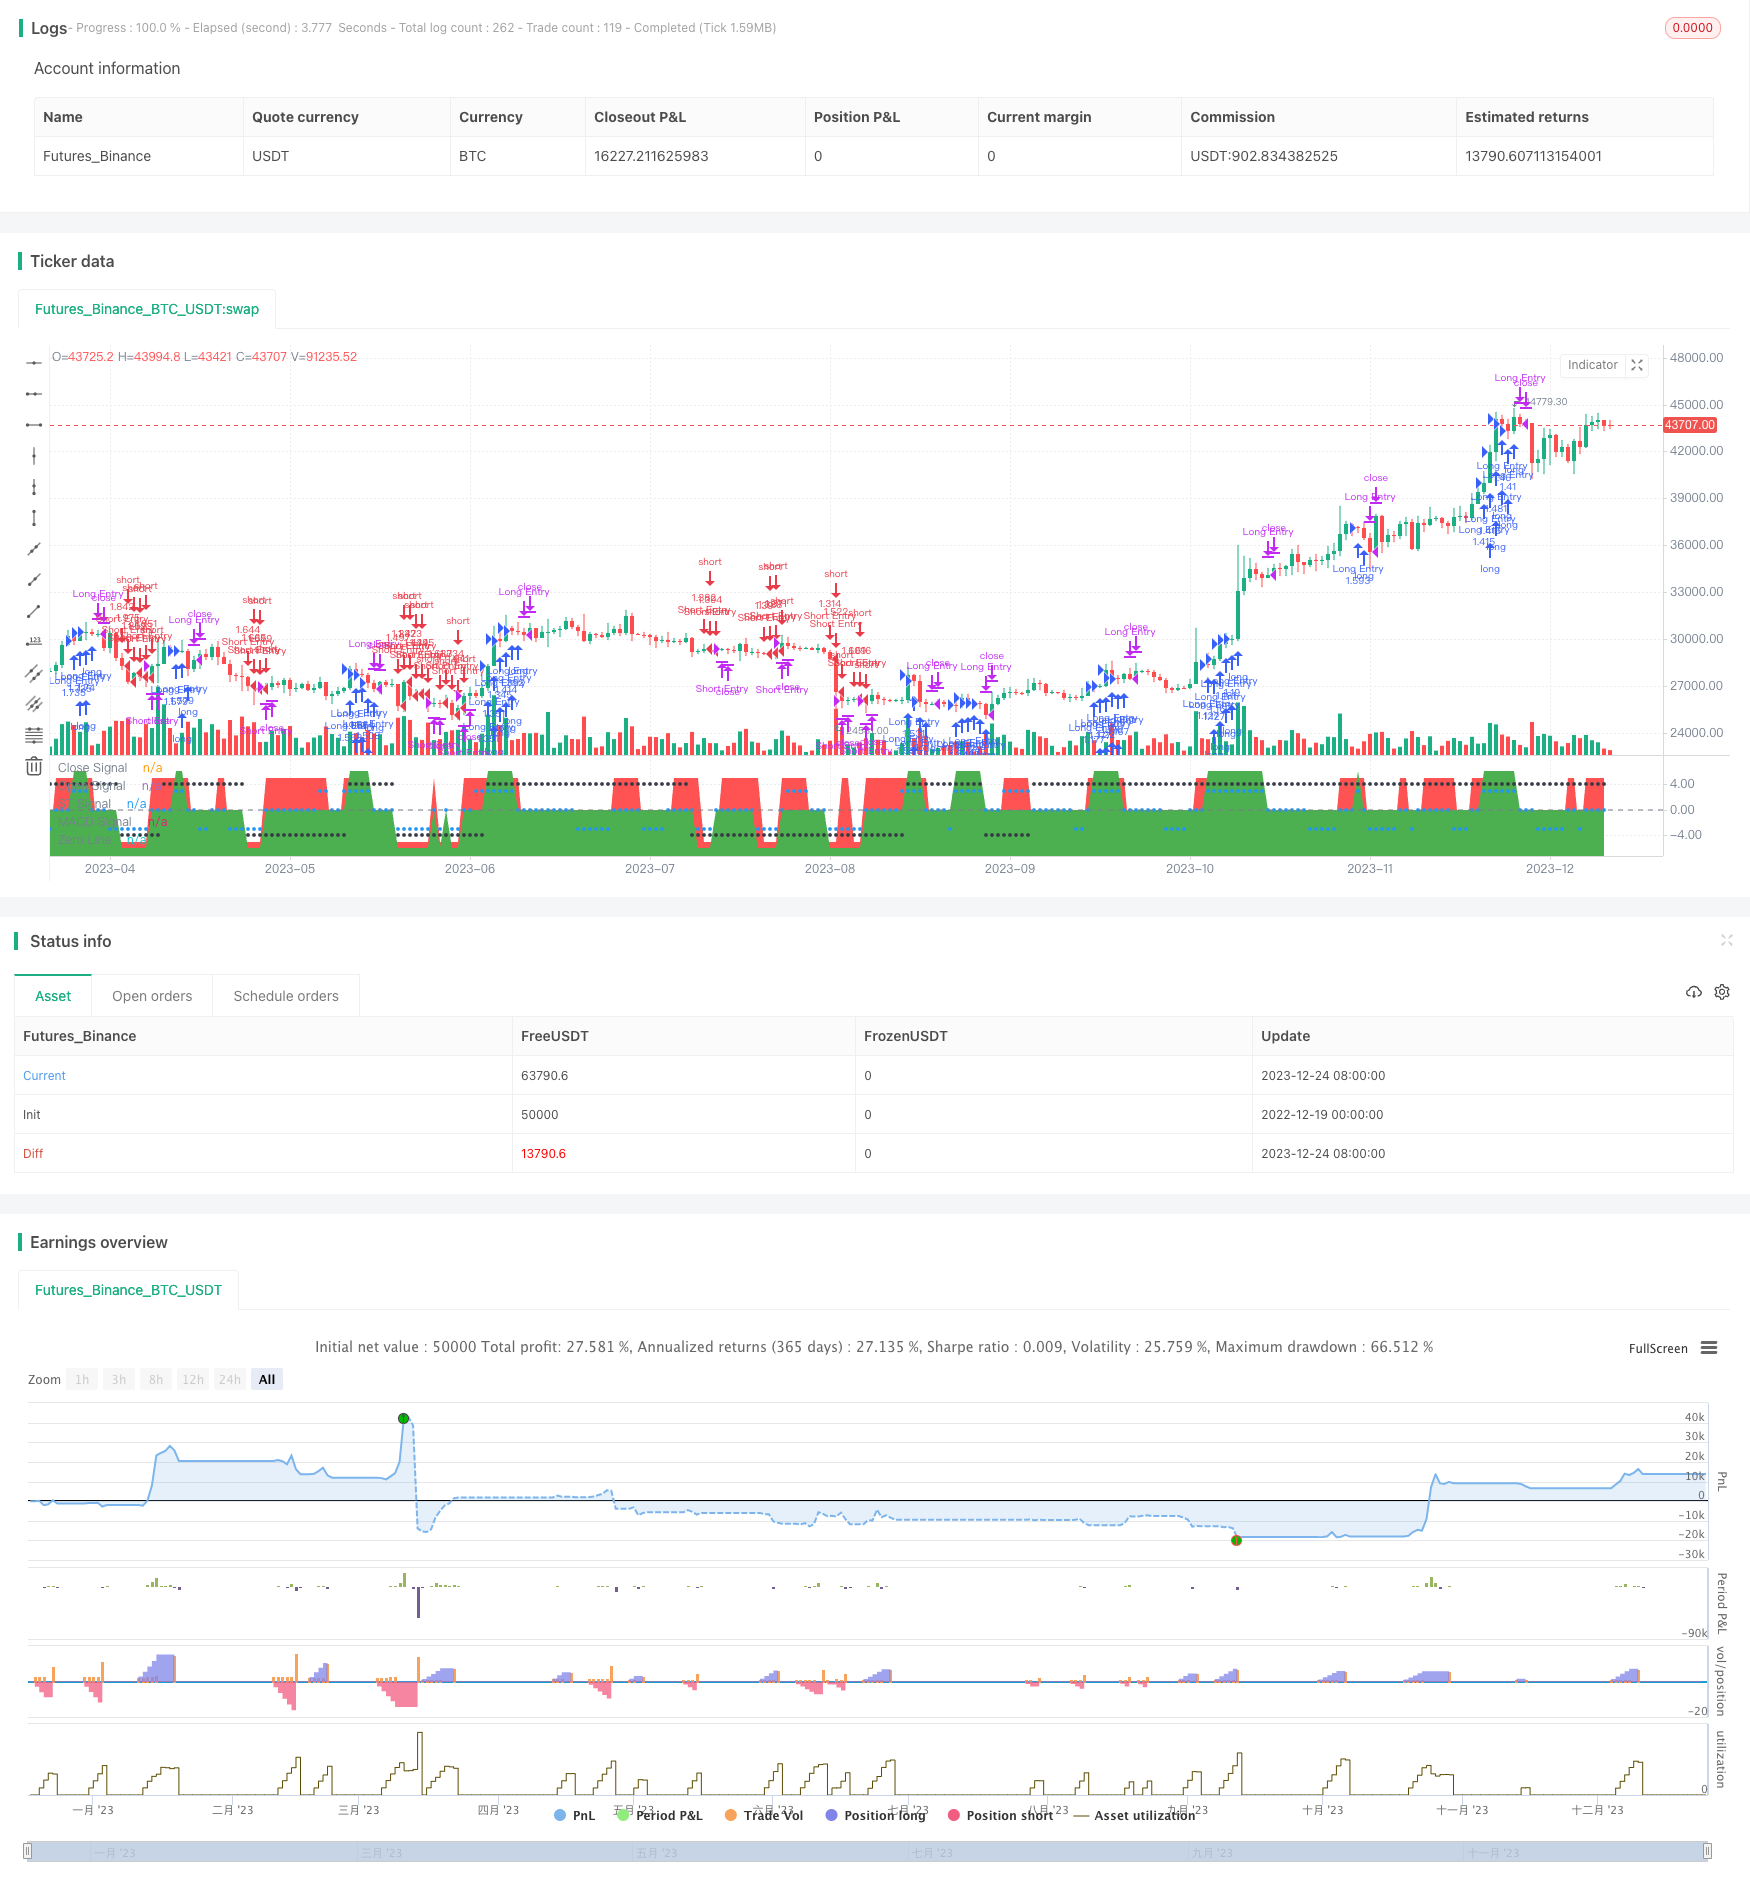
/*backtest
start: 2022-12-19 00:00:00
end: 2023-12-25 00:00:00
period: 1d
basePeriod: 1h
exchanges: [{"eid":"Futures_Binance","currency":"BTC_USDT"}]
*/

//@version=5

strategy("SuperTrend.MACD Strategy", overlay=false, default_qty_type=strategy.percent_of_equity, default_qty_value=100, initial_capital=100000, pyramiding=5, process_orders_on_close=true)

// ---------------- Utility Functions ----------------
getArrayValue(float[] arr, int ago) =>
    if ago >= 0
        array.get(arr, ago >= array.size(arr) ? na: array.size(arr) + -1 * ago -1)
    else
        na

filterNA(float[] a, s, int y) =>
    int x = 0
    if not na(s[0])
        array.push(a, s[0])
        if array.size(a) > y
            array.shift(a)
    a

pine_rsi(float[] x, int y) =>
    x0 = getArrayValue(x, 0)
    x1 = getArrayValue(x, 1)

    u = math.max(x0 - x1, 0) // upward ta.change
    d = math.max(x1 - x0, 0) // downward ta.change
    rs = ta.rma(u, y) / ta.rma(d, y)
    res = 100 - 100 / (1 + rs)
    res

turnAround(float[] arr) =>
    int isTurnAround = 0

    now = getArrayValue(arr, 0)
    p1 = getArrayValue(arr, 1)
    p2 = getArrayValue(arr, 2)

    if p1 > now and p1 > p2
        isTurnAround := -1
    else if p1 < now and p1 < p2
        isTurnAround := 1

intergerizeSignal(i) =>
    i>0 ? 1 : i<0 ? -1 : 0

linreg(float[] y, int n, int offset=0) =>
    float slope = na
    float intercept = na

    int endcursor = offset + n - 1

    if array.size(y) > endcursor
        float sumX = 0
        float sumX2 = 0
        float sumY = 0
        float sumY2 = 0
        float sumXY = 0

        for i=offset to endcursor
            yv = array.get(y, i)
            sumY += yv
            sumY2 += math.pow(yv, 2)
            sumX += i
            sumX2 += math.pow(i, 2)
            sumXY += i*yv

        // Pearson correlation coefficient
        r = (n * sumXY - sumX * sumY) / math.sqrt((n * sumY2 - math.pow(sumY, 2)) * (n * sumX2 - math.pow(sumX, 2)))

        // Coefficient of determination
        r2 = math.pow(r, 2)

        meanX = sumX / n
        meanY = sumY / n

        slope := (n * sumXY - sumX * sumY) / (n * sumX2 - math.pow(sumX, 2))
        intercept := meanY - slope * meanX

    [slope, intercept]

isStartOfDay() => dayofweek != dayofweek[1]

// ---------------- Variables ----------------

varip float st_signal = 0
varip float macd_signal = 0
varip float macd_close_signal = 0
varip float histo_signal = 0

var int openSignal = 0
var int closeSignal = 0

// -------------------------------- Supertrend Signal (Open) --------------------------------

// ST calculation
atrPeriod = input(10, "Supertrend ATR Length")
factor = input.float(2.0, "Supertrend Factor", step = 0.01)

[_, direction] = ta.supertrend(factor, atrPeriod)

st_direction_change = ta.change(direction)
if st_direction_change < 0
    st_signal := 4
if st_direction_change > 0
    st_signal := -4

// -------------------------------- MACD Signal (Open + Close) --------------------------------

// MACD Calculation
fastLength = input(12, title="MACD Fast Length")
slowLength = input(26, title="MACD Slow Length")
signalLength = input(9, title="MACD Signal Length")
macdSlowTimeframe = input.timeframe("D", "MACD Timeframe")
macdSlopeLookbackOpen = input(7, title="MACD Slope Lookback - Open")
macdSlopeLookbackClose = input(3, title="MACD Slope Lookback - Close")

dailyClose = request.security(syminfo.tickerid, macdSlowTimeframe, close, barmerge.gaps_on)
[macdLine, signalLine, _] = ta.macd(dailyClose, fastLength, slowLength, signalLength)

// MACD Slope calculation

varip macdHistory = array.new<float>(0)
varip macdSlowSlopeArr = array.new<float>(0)
varip float macdSlowSlope = na
varip float macdCloseSlope = na

if not na(macdLine[0])
    array.push(macdHistory, macdLine[0])
    if array.size(macdHistory) > macdSlopeLookbackOpen
        array.shift(macdHistory)
    [s1, _] = linreg(macdHistory, macdSlopeLookbackOpen)
    macdSlowSlope := s1

    array.push(macdSlowSlopeArr, macdSlowSlope)
    if array.size(macdSlowSlopeArr) > macdSlopeLookbackClose
        array.shift(macdSlowSlopeArr)
    [s2, _] = linreg(macdSlowSlopeArr, macdSlopeLookbackClose)
    macdCloseSlope := s2

// MACD Signal Calculation
// > open signal
threshold_macdSlowSlope = input.float(0.75, "MACD Slope Open Threshold", step = 0.05)

macdSlowSlopeOverThreshold = math.abs(macdSlowSlope) >= threshold_macdSlowSlope
macdSlowSlopeTrend = macdSlowSlope - getArrayValue(macdSlowSlopeArr, 1)
macdSlowSlopeTrendConfirm = macdSlowSlope*macdSlowSlopeTrend >0

if (macdSlowSlopeOverThreshold and macdSlowSlopeTrendConfirm)
    macd_signal := 3*macdSlowSlope/math.abs(macdSlowSlope)
else
    macd_signal := 0

// > close signal
int macdCloseSignal = 0
macdCloseSignal := intergerizeSignal(macdCloseSlope)

// Histogram signal Calculation
histSlow = macdLine - signalLine

if (ta.crossover(histSlow, 0))
	histo_signal := 2
if (ta.crossunder(histSlow, 0))
	histo_signal := -2

// -------------------------------- RSI Signal (Close) --------------------------------
int rsiCloseSignal = 0
varip float rsiSlow = na

rsiPeriod = input(14, title="RSI Period")

varip dailyCloseRSIFilter = array.new_float()

// rewrite pine_rsi to remove NaN value from series at calculation
dailyCloseRSIFilter := filterNA(dailyCloseRSIFilter, dailyClose, rsiPeriod)

if not na(dailyClose[0])
    rsiSlow := pine_rsi(dailyCloseRSIFilter, rsiPeriod)

if rsiSlow > 80
    rsiCloseSignal := -1
else if rsiSlow < 20
    rsiCloseSignal := 1
else
    rsiCloseSignal := 0

// -------------------------------- Overall Signal --------------------------------

// Close signal
closeSignals = array.from(macdCloseSignal, rsiCloseSignal)
closeSignal := array.includes(closeSignals, 1) ? 1 : array.includes(closeSignals, -1) ? -1 : 0
closeSignal := closeSignal * 5

// Open signal
if (macd_signal * st_signal > 0) and (macd_signal * macd_close_signal >= 0)
    openSignal := intergerizeSignal(st_signal)
    openSignal := openSignal * 6
else
    openSignal := 0

// -------------------------------- Order --------------------------------
// if strategy.position_size == 0
if openSignal * closeSignal >=0
    if openSignal > 0
        strategy.entry("Long Entry", strategy.long)
    else if openSignal < 0
        strategy.entry("Short Entry", strategy.short)

if strategy.position_size != 0
    if closeSignal < 0
        strategy.close("Long Entry")
    if closeSignal > 0
        strategy.close("Short Entry")


// -------------------------------- Plot --------------------------------

plot(closeSignal, title="Close Signal", color=color.red, linewidth = 1, style=plot.style_area)
plot(openSignal, title="Open Signal", color=color.green, linewidth = 1, style=plot.style_area)
plot(st_signal, title="ST Signal", color=color.black, linewidth = 1, style=plot.style_circles)
plot(macd_signal, title="MACD Signal", color=color.blue, linewidth = 1, style=plot.style_circles)
// plot(macdSlowSlope, title="macd slow slope", color=color.purple, linewidth = 1, style=plot.style_line)
// plot(macdCloseSlope, title="macd slow slope", color=color.lime, linewidth = 1, style=plot.style_line)

hline(0, "Zero Line", color=color.gray)