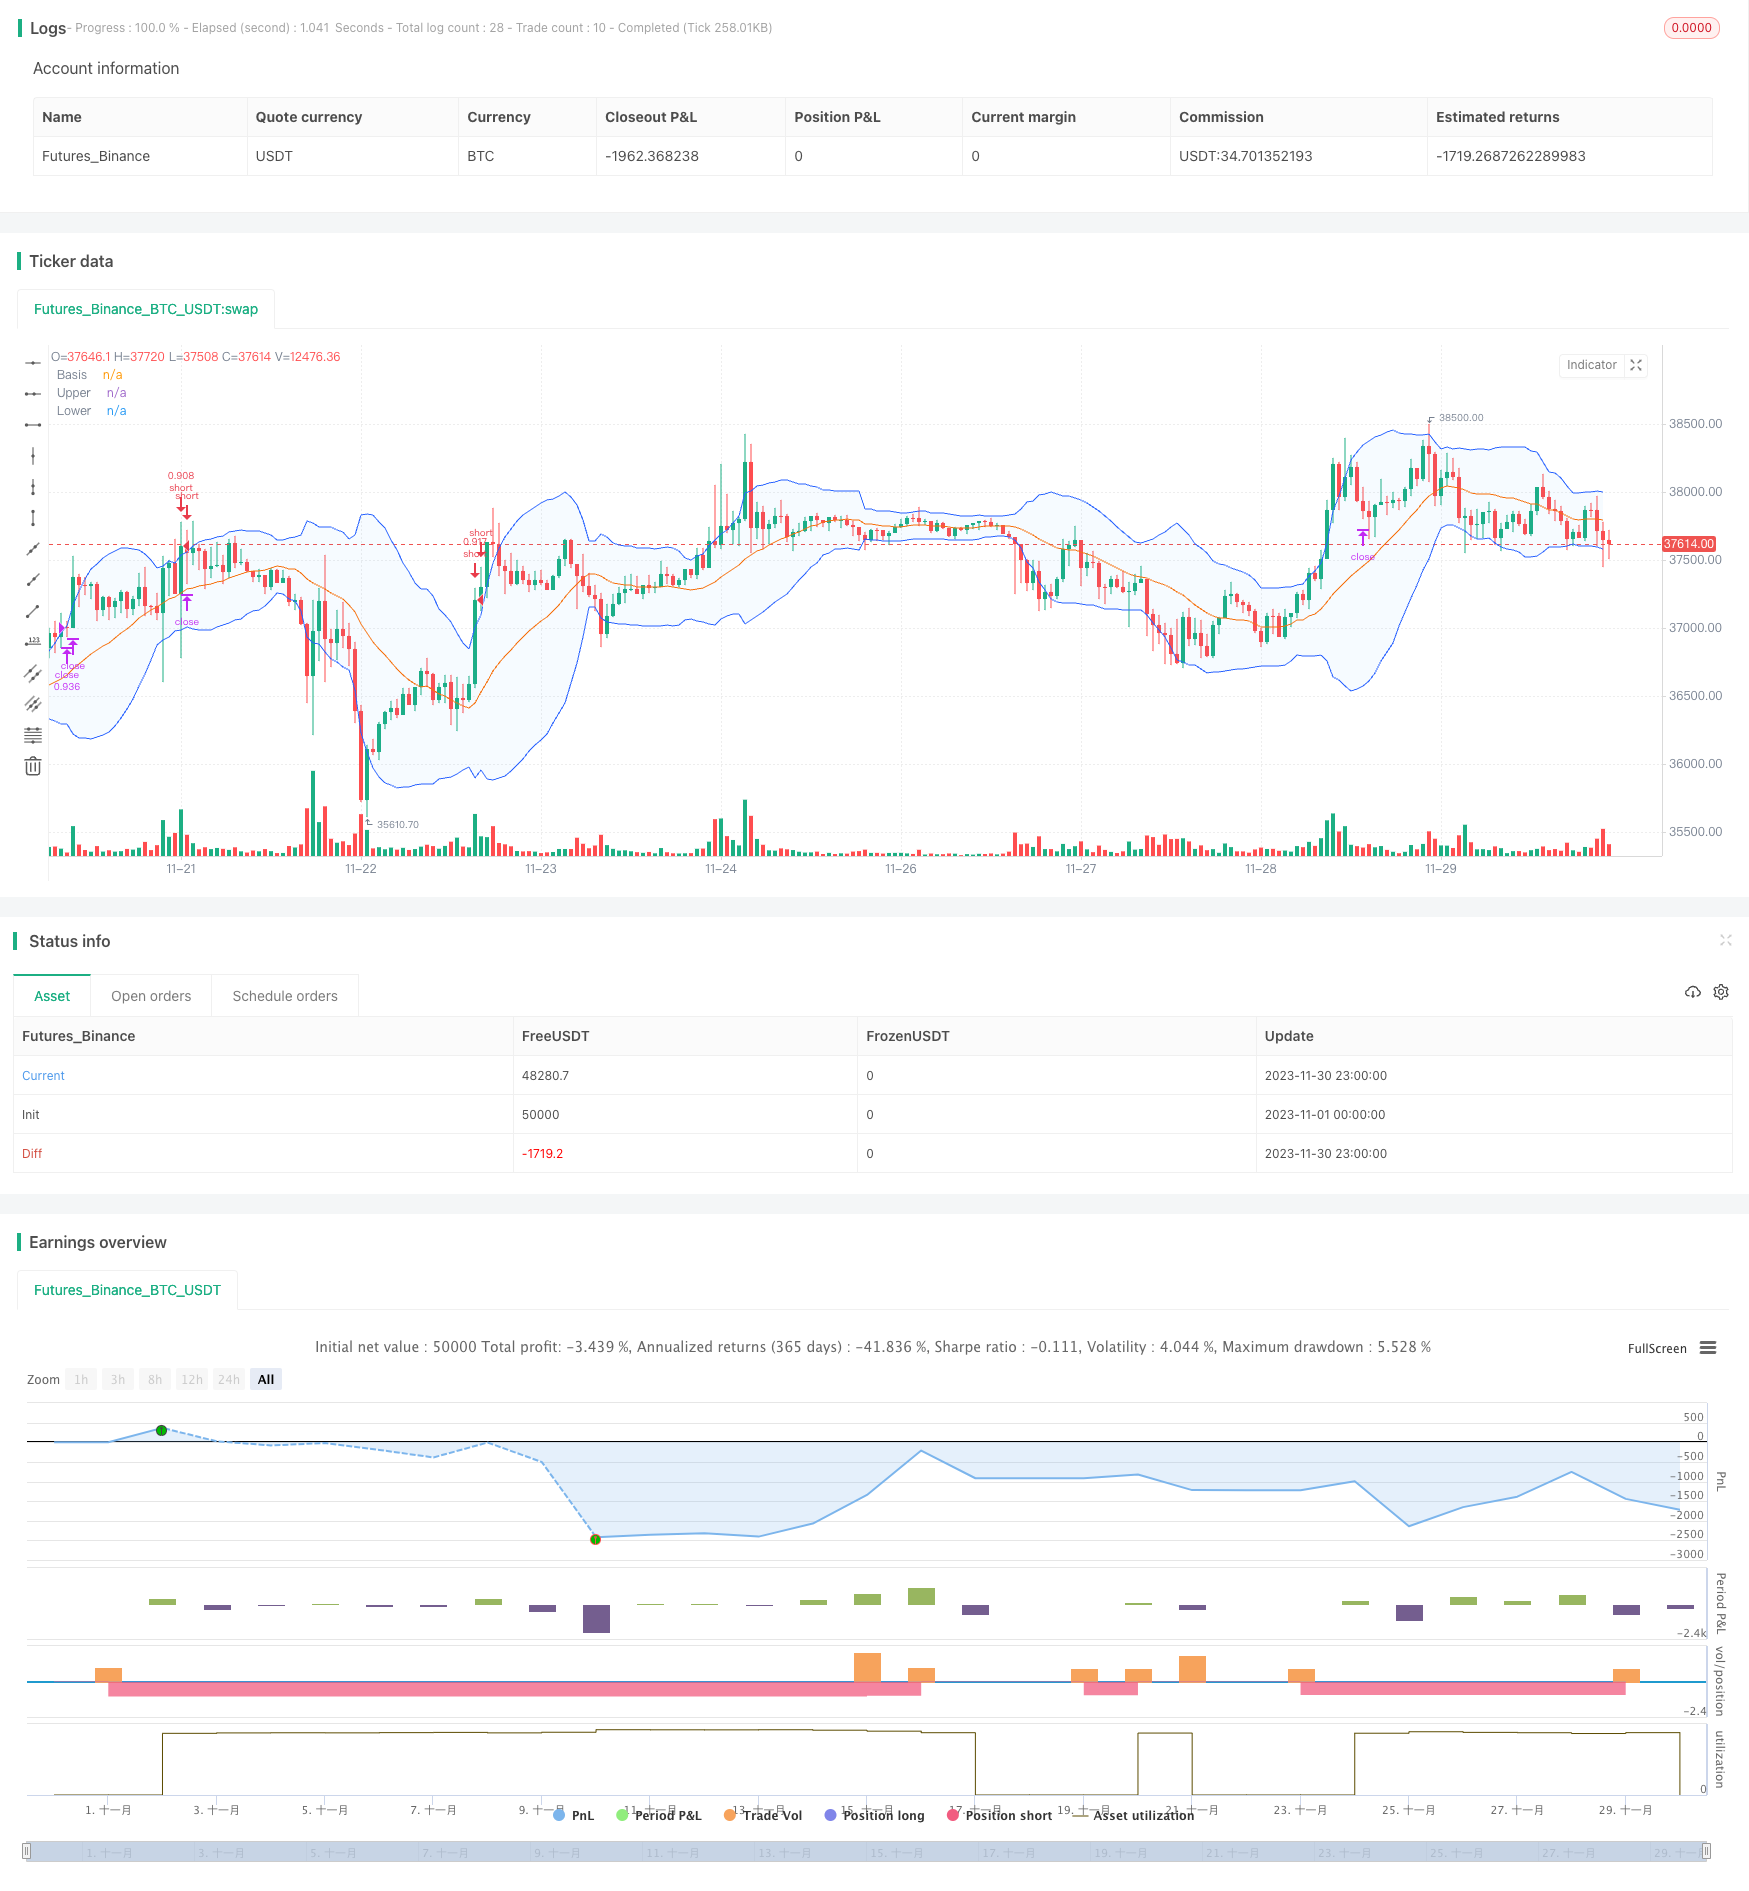
概述
该策略利用布林带指标判断价格是否进入超买超卖区域,结合RSI指标判断是否存在回调机会,在超买区形成死叉时做空,在价格上涨超过布林带上轨时止损。
策略原理
该策略主要基于以下原理:
- 当收盘价格上穿布林带上轨时,表示资产进入超买区域,存在回调机会
- RSI指标可以有效判断超买超卖区域,RSI>70为超买区
- 当收盘价格从上轨下穿时,做空头仓
- 当RSI从超买区回落或止损点触发时,平仓止损
优势分析
该策略具有以下优势:
- 利用布林带判断超买超卖区域,提高 trades的成功率
- 结合RSI指标过滤假突破的机会,避免不必要的 loss
- 损益比高,最大程度控制风险
风险分析
该策略存在以下风险:
- 突破上轨后继续上涨导致 loss 进一步扩大
- RSI未能及时回落,loss 进一步扩大
- 单边持仓,无法交易盘整市
可以通过以下方法降低风险:
- 适当调整止损点,及时止损
- 组合其他指标判断RSI回落信号
- 结合均线指标,判断是否进入盘整
优化方向
该策略可以从以下方面进行优化:
- 优化布林带参数,适应更多交易品种
- 优化 RSI 参数,提高指标效果
- 增加其他指标组合,判断趋势反转点
- 增加多头交易逻辑
- 结合止损策略,动态调整止损点
总结
该策略整体来说是一种典型的超买区快速短线交易策略。利用布林带判断买卖点,RSI过滤信号。通过合理止损来控制风险水平。可以通过参数优化,组合指标,增加开仓逻辑等方式进行效果提升。
策略源码
/*backtest
start: 2023-11-01 00:00:00
end: 2023-11-30 23:59:59
period: 1h
basePeriod: 15m
exchanges: [{"eid":"Futures_Binance","currency":"BTC_USDT"}]
*/

//@version=5
// This source code is subject to the terms of the Mozilla Public License 2.0 at https://mozilla.org/MPL/2.0/
// © Coinrule


strategy("Bollinger Band Below Price with RSI",
         overlay=true,
         initial_capital=1000,
         process_orders_on_close=true,
         default_qty_type=strategy.percent_of_equity,
         default_qty_value=70,
         commission_type=strategy.commission.percent,
         commission_value=0.1)

showDate = input(defval=true, title='Show Date Range')
timePeriod = time >= timestamp(syminfo.timezone, 2022, 1, 1, 0, 0)
notInTrade = strategy.position_size <= 0

//Bollinger Bands Indicator
length = input.int(20, minval=1)
src = input(close, title="Source")
mult = input.float(2.0, minval=0.001, maxval=50, title="StdDev")
basis = ta.sma(src, length)
dev = mult * ta.stdev(src, length)
upper = basis + dev
lower = basis - dev
offset = input.int(0, "Offset", minval = -500, maxval = 500)
plot(basis, "Basis", color=#FF6D00, offset = offset)
p1 = plot(upper, "Upper", color=#2962FF, offset = offset)
p2 = plot(lower, "Lower", color=#2962FF, offset = offset)
fill(p1, p2, title = "Background", color=color.rgb(33, 150, 243, 95))

// RSI inputs and calculations
lengthRSI = 14
RSI = ta.rsi(close, lengthRSI)


// Configure trail stop level with input options
longTrailPerc = input.float(title='Trail Long Loss (%)', minval=0.0, step=0.1, defval=3) * 0.01
shortTrailPerc = input.float(title='Trail Short Loss (%)', minval=0.0, step=0.1, defval=3) * 0.01

// Determine trail stop loss prices
//longStopPrice = 0.0
shortStopPrice = 0.0

//longStopPrice := if strategy.position_size > 0
    //stopValue = close * (1 - longTrailPerc)
    //math.max(stopValue, longStopPrice[1])
//else
    //0

shortStopPrice := if strategy.position_size < 0
    stopValue = close * (1 + shortTrailPerc)
    math.min(stopValue, shortStopPrice[1])
else
    999999


//Entry and Exit
strategy.entry(id="short", direction=strategy.short, when=ta.crossover(close, upper) and RSI < 70 and timePeriod and notInTrade)

if (ta.crossover(upper, close) and RSI > 70 and timePeriod)
    strategy.exit(id='close', limit = shortStopPrice)