概述
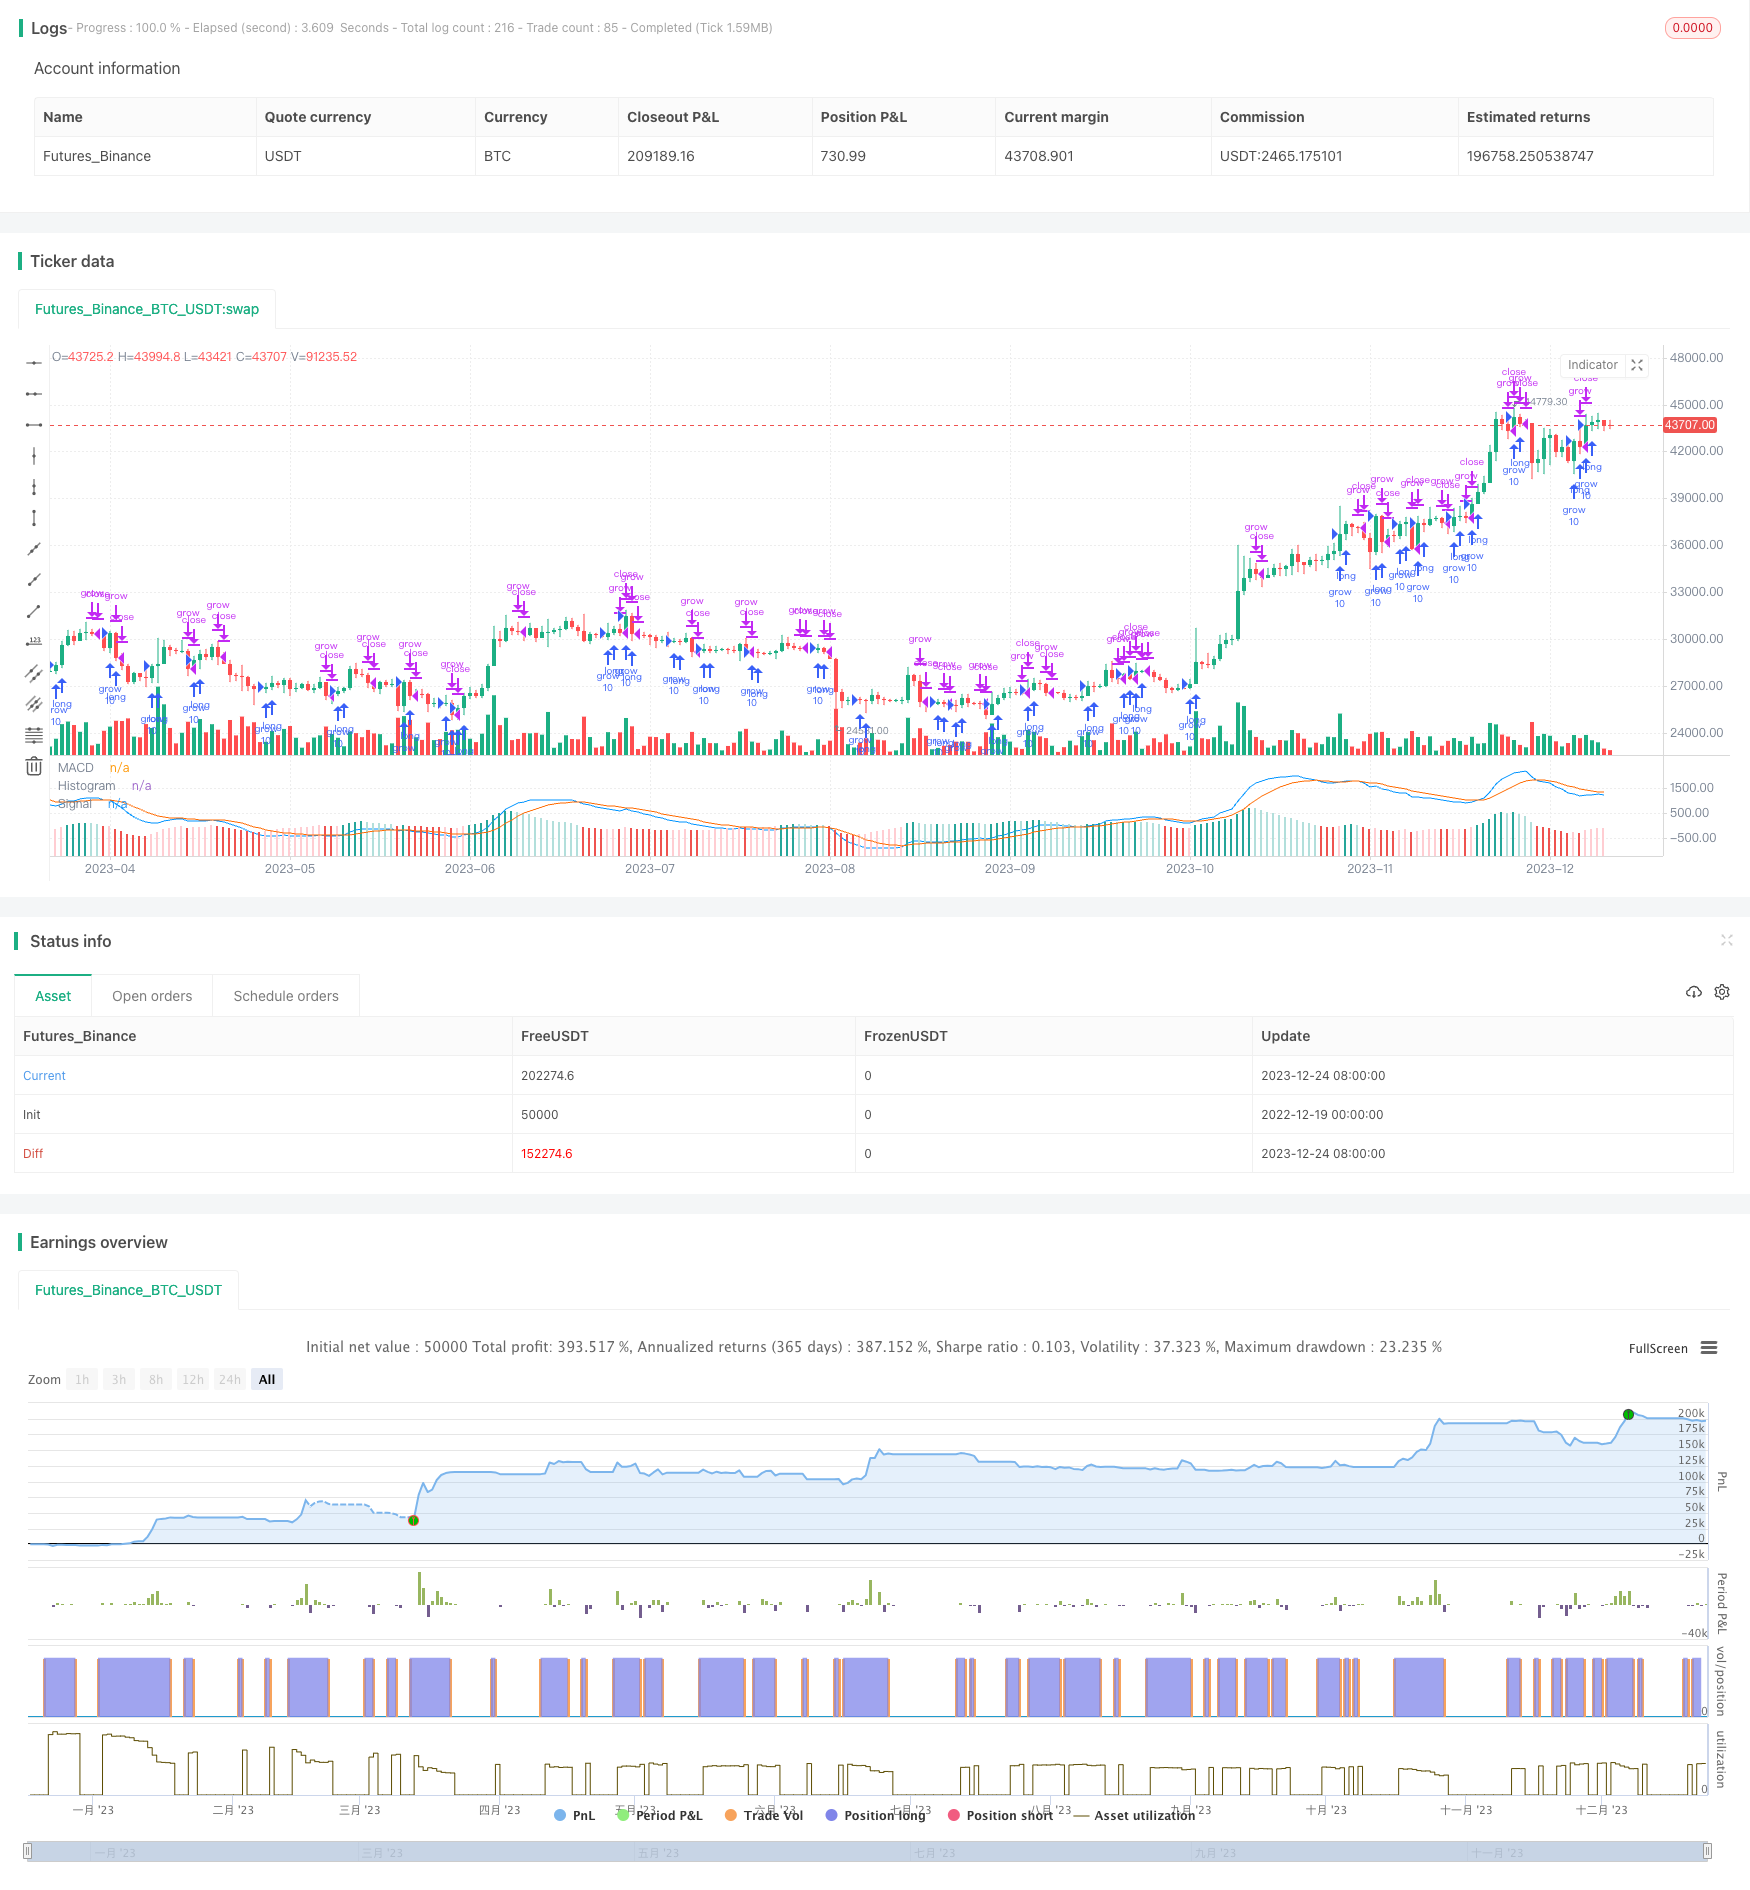
本策略通过计算快线EMA和慢线EMA的差值形成MACD震荡器,再通过计算MACD的均线形成信号线,从而构建一个双重滤波系统。当MACD线从下方上穿信号线时产生买入信号,当MACD线从上方下穿信号线时产生卖出信号,利用价格的短期中期波动获利。
策略原理
本策略的核心指标是MACD震荡器,它由快线EMA(一般设置为12日EMA)减去慢线EMA(一般设置为26日EMA)计算得到。快线EMA更加灵敏,能捕捉价格的短期波动;慢线EMA对价格变化的响应更加缓慢。两者相减可形成一个代表短期和中期周期价格变化差值的震荡器。再对MACD震荡器计算其本身的EMA(一般设置为9日),得到信号线。当MACD从信号线下方向上穿过时,代表短期行情的向上动力强于中期行情,产生买入信号;当MACD从信号线上方向下穿过时,代表短期行情的向下动力强于中期行情,产生卖出信号。
本策略设置输入参数分别为快线长度、慢线长度、价格源、信号线长度平滑周期。可根据不同市场调整参数,寻找最佳参数组合。背景色块显示了回测的时间范围。策略在该时间范围内开仓,之外不操作。
优势分析
MACD指标经典且易于理解,能有效抓取短中期倒挂机会。
双EMA构建的MACD系统相对单一MA系统有更好的平滑性。
可调参数较多,可以针对不同市场进行参数优化。
结合成交量指标可识别高质量信号。
风险分析
在震荡行情中,MACD指标会产生更多错误信号。
无法判断趋势,可能与趋势交叉产生损失。
回测时间范围限制可能忽略了极端行情的情况。
参数设置需要combine更多市场数据进行优化,否则可能overfit某一市场段。
可通过结合趋势判断指标,设置止损机制来控制风险。同时扩大回测范围和市场样本空间进行参数优化。
优化方向
测试不同价格源,如收盘价、均价、重置价等。
基于更多历史数据寻找最佳参数组合。
整合其他指标判断信号质量。例如成交量信号。
结合趋势和波段判断,避免与趋势产生重大冲突。
总结
本策略通过构建双EMA滤波器,捕捉价格中短线周期的倒挂现象,属于经典且实用的择时策略。可通过参数优化、信号过滤、止损手段控制风险。同时结合趋势判断指标,避免追顶杀底,可以获得稳定收益。
/*backtest
start: 2022-12-19 00:00:00
end: 2023-12-25 00:00:00
period: 1d
basePeriod: 1h
exchanges: [{"eid":"Futures_Binance","currency":"BTC_USDT"}]
*/

//@version=4
strategy(title="MACD Histogram Backtest", shorttitle="MACD")

// Getting inputs
fast_length = input(title="Fast Length", type=input.integer, defval=12)
slow_length = input(title="Slow Length", type=input.integer, defval=26)
src = input(title="Source", type=input.source, defval=close)
signal_length = input(title="Signal Smoothing", type=input.integer, minval = 1, maxval = 50, defval = 9)
sma_source = input(title="Simple MA(Oscillator)", type=input.bool, defval=false)
sma_signal = input(title="Simple MA(Signal Line)", type=input.bool, defval=false)

// Plot colors
col_grow_above = #26A69A
col_grow_below = #FFCDD2
col_fall_above = #B2DFDB
col_fall_below = #EF5350
col_macd = #0094ff
col_signal = #ff6a00

// Calculating
fast_ma = sma_source ? sma(src, fast_length) : ema(src, fast_length)
slow_ma = sma_source ? sma(src, slow_length) : ema(src, slow_length)
macd = fast_ma - slow_ma
signal = sma_signal ? sma(macd, signal_length) : ema(macd, signal_length)
hist = macd - signal

grow = (hist[1] < hist)
fall = (hist[1] > hist) and hist >= 0
stop = (hist[1] > hist)

plot(hist, title="Histogram", style=plot.style_columns, color=(hist>=0 ? (hist[1] < hist ? col_grow_above : col_fall_above) : (hist[1] < hist ? col_grow_below : col_fall_below) ), transp=0 )
plot(macd, title="MACD", color=col_macd, transp=0)
plot(signal, title="Signal", color=col_signal, transp=0)

//Strategy Testing

// Component Code Start
// Example usage:
// if testPeriod()
//   strategy.entry("LE", strategy.long)
testStartYear = input(2017, "Backtest Start Year")
testStartMonth = input(01, "Backtest Start Month")
testStartDay = input(2, "Backtest Start Day")
testPeriodStart = timestamp(testStartYear,testStartMonth,testStartDay,0,0)

testStopYear = input(2019, "Backtest Stop Year")
testStopMonth = input(12, "Backtest Stop Month")
testStopDay = input(30, "Backtest Stop Day")
testPeriodStop = timestamp(testStopYear,testStopMonth,testStopDay,0,0)

// A switch to control background coloring of the test period
testPeriodBackground = input(title="Color Background?", type=input.bool, defval=true)
testPeriodBackgroundColor = testPeriodBackground and (time >= testPeriodStart) and (time <= testPeriodStop) ? #00FF00 : na
bgcolor(testPeriodBackgroundColor, transp=97)

testPeriod() => true
// Component Code Stop

//Entry and Close settings
if testPeriod()
    strategy.entry("grow", true, 10, when = grow, limit = close)
    strategy.close("grow", when = fall)
    strategy.close("grow", when = stop)

//if testPeriod()
//   strategy.entry("fall", false, 1000, when = fall, limit = close)
//    strategy.close("fall", when = grow)