概述
本策略将布林线与相对强弱指标(RSI)相结合,在RSI指标超买超卖的同时,需要对应的突破布林线的上下轨,这样使得本策略的交易信号更加严格和可靠。
策略原理
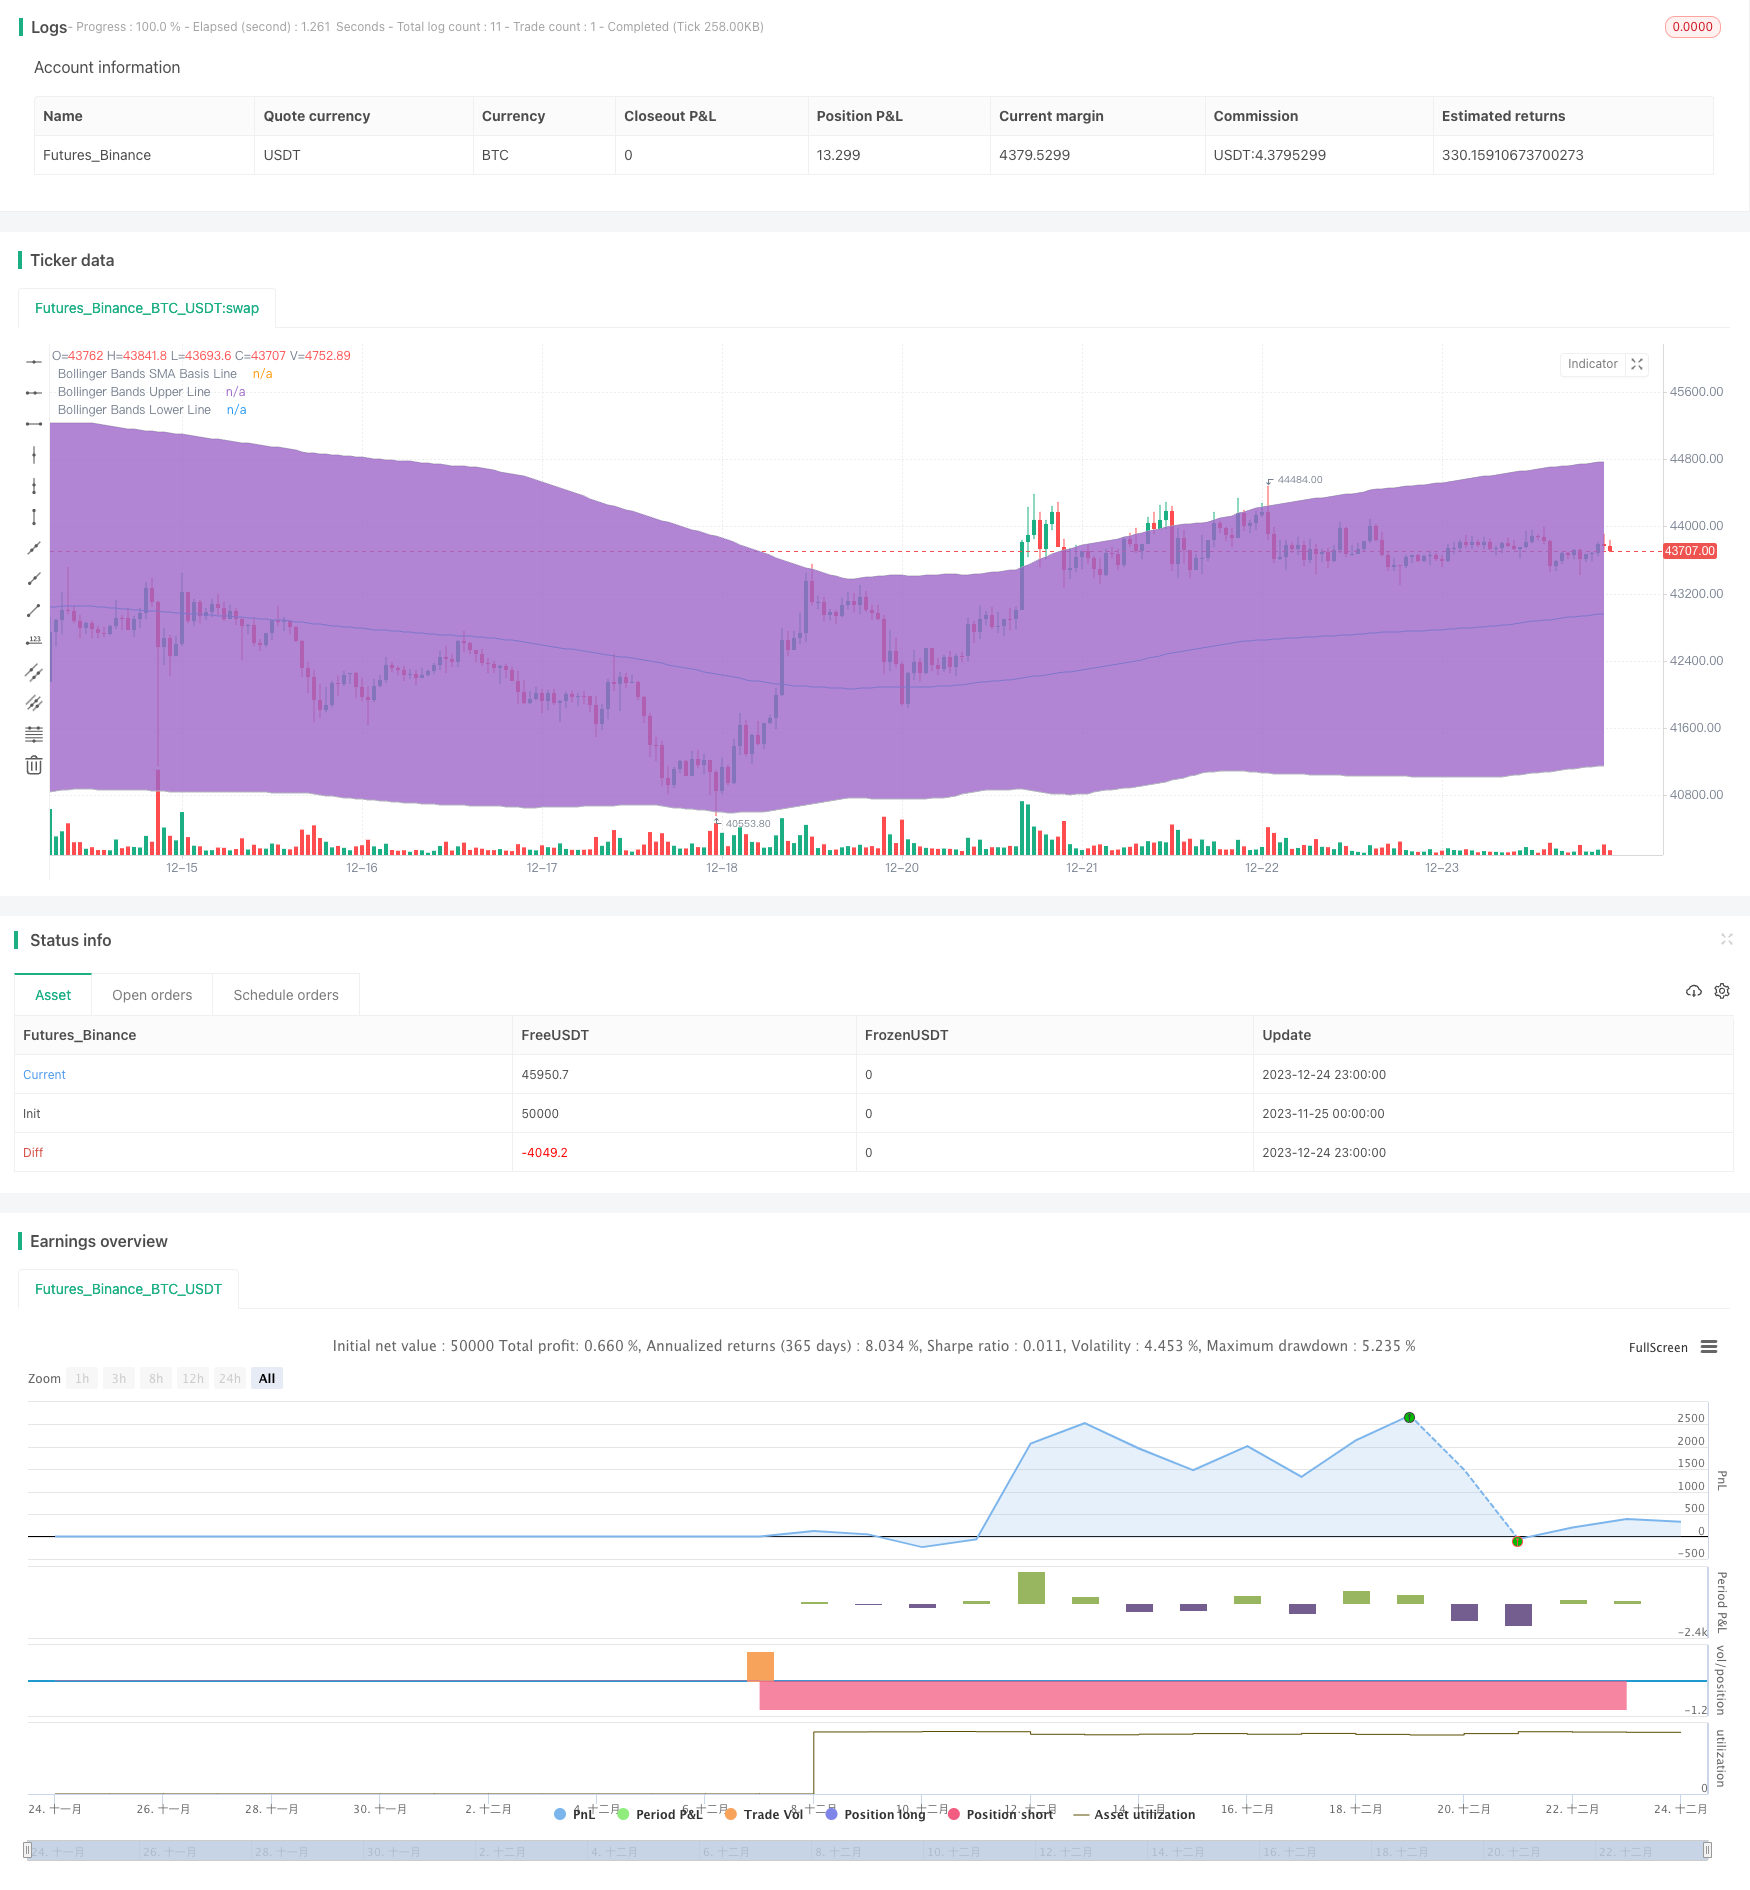
- 使用布林线,根据前期n天的收盘价计算出中轨线、上轨线和下轨线。
- 计算RSI指标,判断市场是否过度看涨或看跌。
- 只有当RSI指标显示超买(高于rsi_overbought参数),且价格突破布林线上轨时,做空头交易。
- 只有当RSI指标显示超卖(低于rsi_oversold参数),且价格突破布林线下轨时,做多头交易。
这样,本策略同时利用布林线的通道特征和RSI指标的超买超卖信号,避免单一指标判断错误,更加可靠。
策略优势
- 综合利用布林线与RSI指标的优势,判断更加严格,避免失误。
- 布林线设定动态通道,能够把握市场波动规律。
- RSI判断超买超卖情况,避免追高杀跌。
策略风险
- 布林线参数若设定不当,上下轨无法有效包住价格。
- RSI参数若设定不当,无法有效判断真实的超买超卖情况。
- 策略本身无法判断趋势方向,需要搭配其他指标使用。
针对以上风险,应该优化参数,严格测试模型,并辅以其他指标判断大趋势。
策略优化方向
- 测试不同周期参数的布林线,找到最佳周期参数。
- 测试不同参数RSI指标,确定较优参数。
- 可以加入移动均线等其他指标判断总体趋势。
总结
本策略成功结合了布林线与RSI指标的优势,在两者同时出现信号时发出交易指令,这样可以有效避免单一指标判断失误的情况,使得交易更加可靠。同时,也要优化参数,严格测试,并辅以其他指标判断大趋势,从而进一步提高策略的稳定性和收益率。
策略源码
/*backtest
start: 2023-11-25 00:00:00
end: 2023-12-25 00:00:00
period: 1h
basePeriod: 15m
exchanges: [{"eid":"Futures_Binance","currency":"BTC_USDT"}]
*/

//@version=2
strategy("Bollinger + RSI, Double Strategy (by ChartArt) v1.1", shorttitle="CA_-_RSI_Bol_Strat_1.1", overlay=true)

// ChartArt's RSI + Bollinger Bands, Double Strategy - Update
//
// Version 1.1
// Idea by ChartArt on January 18, 2015.
//
// This strategy uses the RSI indicator
// together with the Bollinger Bands
// to sell when the price is above the
// upper Bollinger Band (and to buy when
// this value is below the lower band).
//
// This simple strategy only triggers when
// both the RSI and the Bollinger Bands
// indicators are at the same time in
// a overbought or oversold condition.
//
// In this version 1.1 the strategy was
// both simplified for the user and
// made more successful in backtesting.
//
// List of my work:
// https://www.tradingview.com/u/ChartArt/
//
//  __             __  ___       __  ___
// /  ` |__|  /\  |__)  |   /\  |__)  |
// \__, |  | /~~\ |  \  |  /~~\ |  \  |
//
//


///////////// RSI
RSIlength = input(6,title="RSI Period Length")
RSIoverSold = 50
RSIoverBought = 50
price = close
vrsi = rsi(price, RSIlength)


///////////// Bollinger Bands
BBlength = input(200, minval=1,title="Bollinger Period Length")
BBmult = 2 // input(2.0, minval=0.001, maxval=50,title="Bollinger Bands Standard Deviation")
BBbasis = sma(price, BBlength)
BBdev = BBmult * stdev(price, BBlength)
BBupper = BBbasis + BBdev
BBlower = BBbasis - BBdev
source = close
buyEntry = crossover(source, BBlower)
sellEntry = crossunder(source, BBupper)
plot(BBbasis, color=aqua,title="Bollinger Bands SMA Basis Line")
p1 = plot(BBupper, color=silver,title="Bollinger Bands Upper Line")
p2 = plot(BBlower, color=silver,title="Bollinger Bands Lower Line")
fill(p1, p2)


///////////// Colors
switch1=input(true, title="Enable Bar Color?")
switch2=input(true, title="Enable Background Color?")
TrendColor = RSIoverBought and (price[1] > BBupper and price < BBupper) and BBbasis < BBbasis[1] ? red : RSIoverSold and (price[1] < BBlower and price > BBlower) and BBbasis > BBbasis[1] ? green : na
barcolor(switch1?TrendColor:na)
bgcolor(switch2?TrendColor:na,transp=50)


///////////// RSI + Bollinger Bands Strategy
if (not na(vrsi))

    if (crossover(vrsi, RSIoverSold) and crossover(source, BBlower))
        strategy.entry("RSI_BB_L", strategy.long, stop=BBlower,  comment="RSI_BB_L")
    else
        strategy.cancel(id="RSI_BB_L")

    if (crossunder(vrsi, RSIoverBought) and crossunder(source, BBupper))
        strategy.entry("RSI_BB_S", strategy.short, stop=BBupper,  comment="RSI_BB_S")
    else
        strategy.cancel(id="RSI_BB_S")

//plot(strategy.equity, title="equity", color=red, linewidth=2, style=areabr)