概述
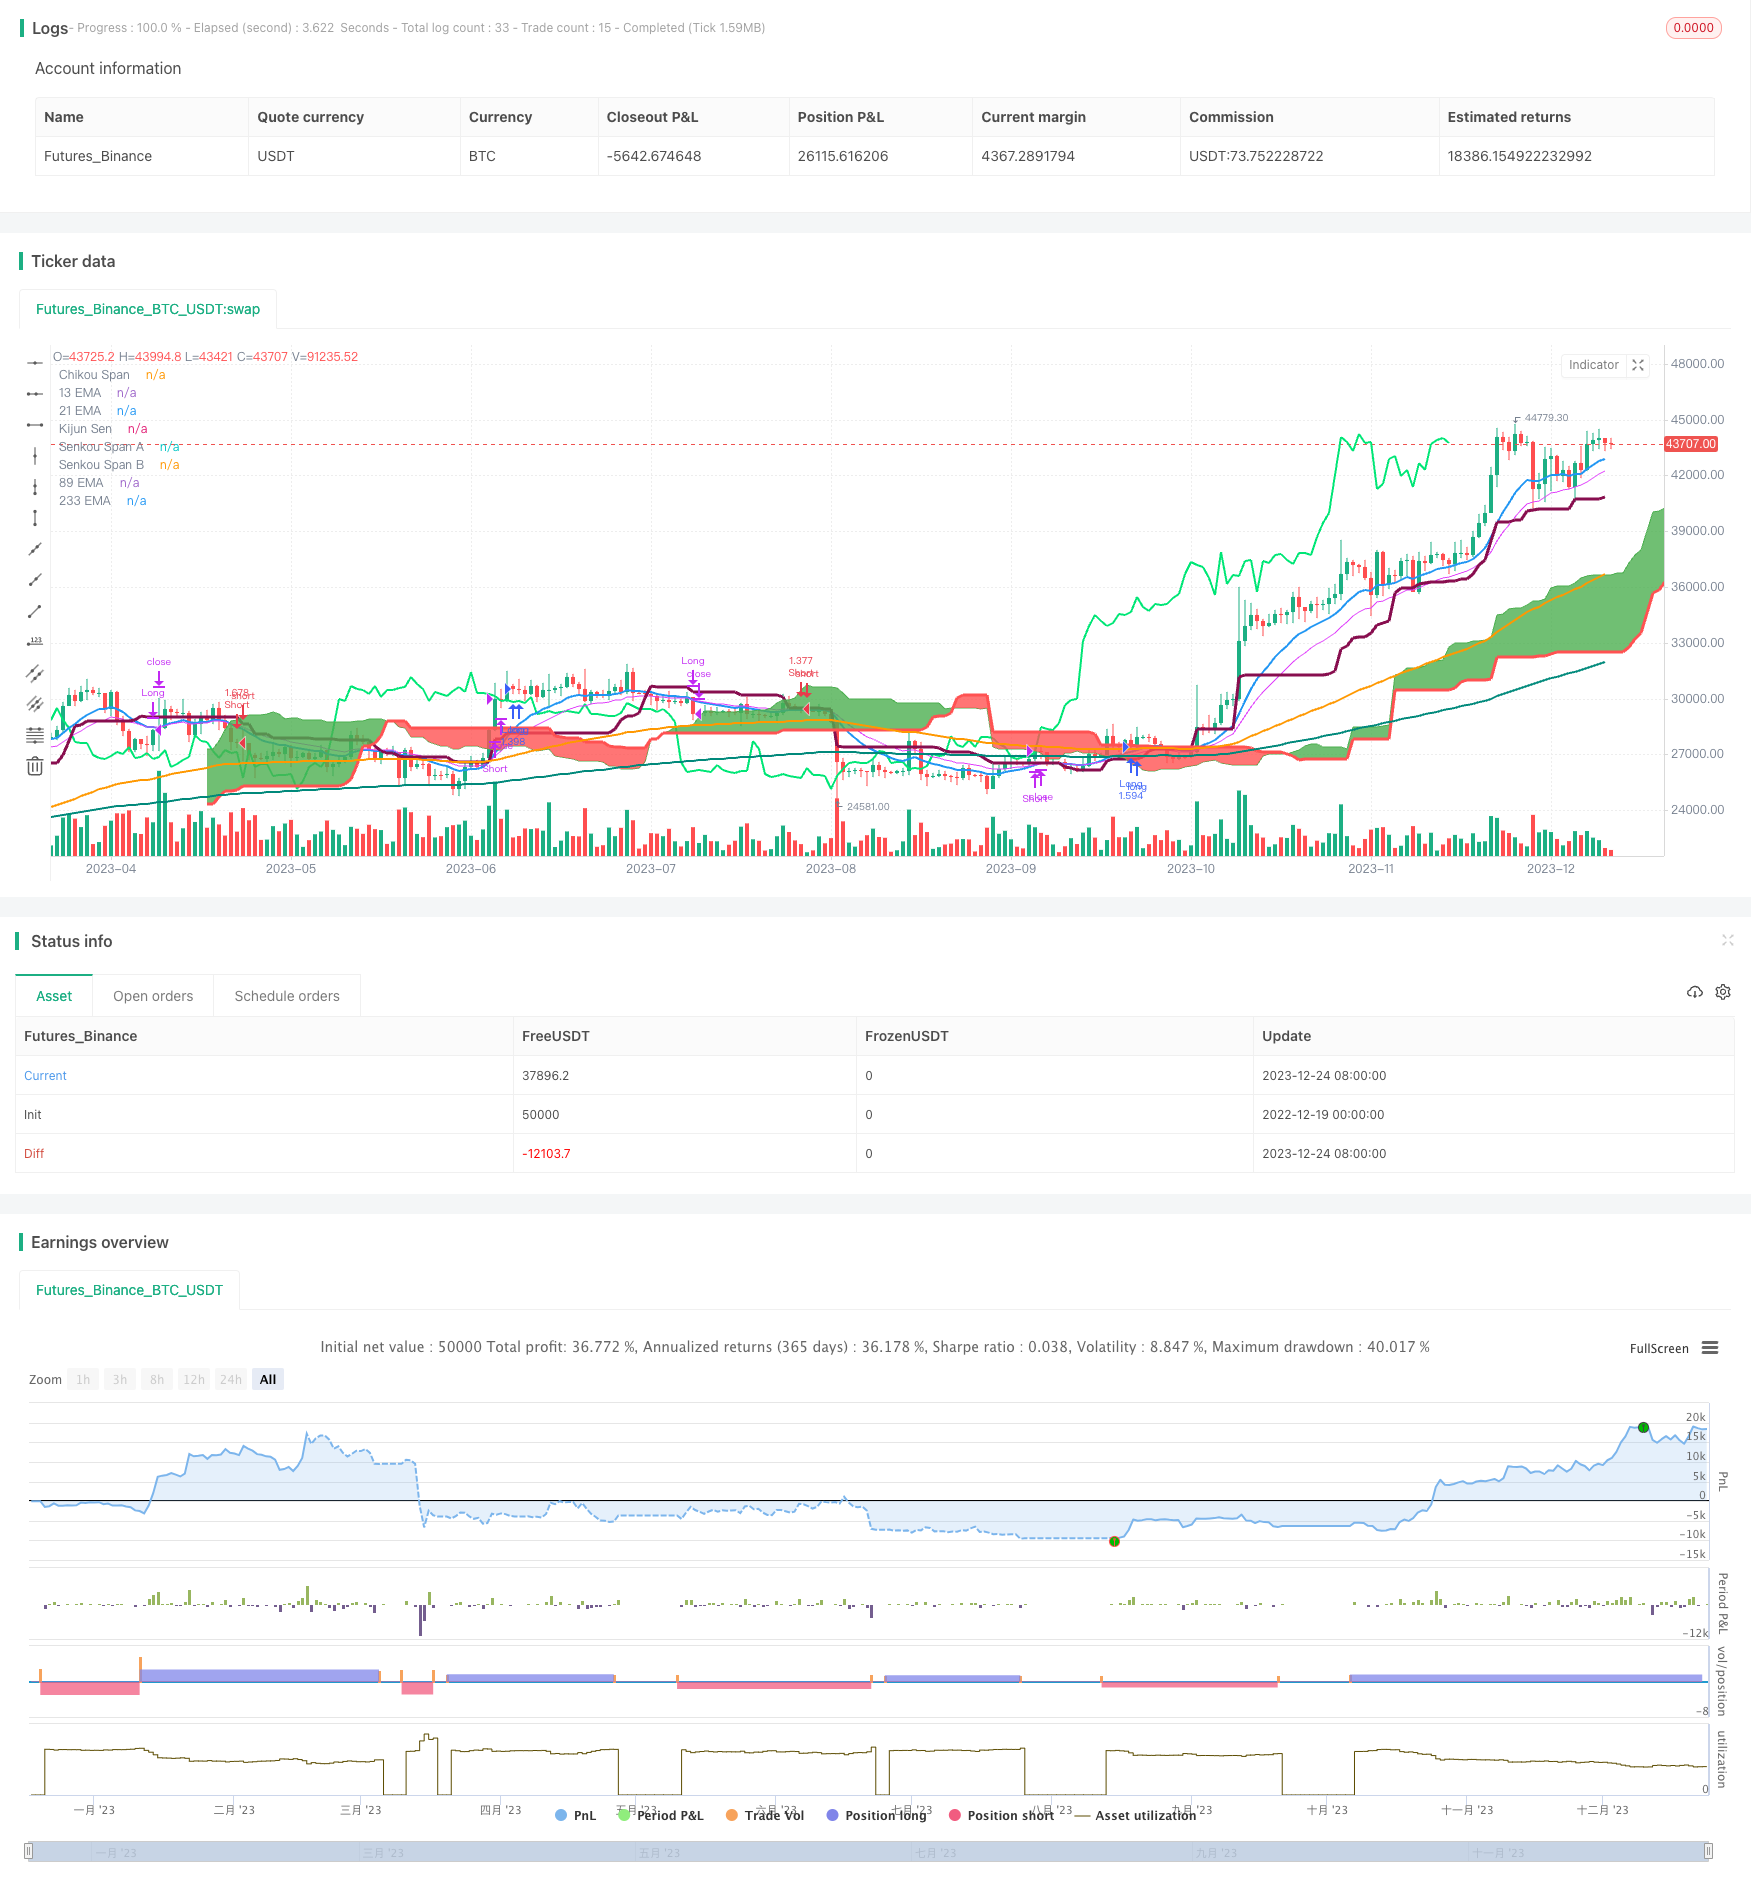
该策略通过Ichimoku云带指标与双均线指标的组合,形成长短期动量判断,实现高精度的趋势判断与交易信号产生。其中,Ichimoku云带由转向线,基准线,先导线组成,判断价格动能和未来走势。双均线部分由13周期与21周期指数移动平均线组成,判断短期价格动量变化。两者的组合,实现了多时间维度的综合判断,过滤假突破,提高信号质量。
策略原理
该策略主要由Ichimoku云带指标和双指数移动平均线指标组成。
Ichimoku云带中,基准线代表中期趋势,转向线代表短期趋势,云带代表支撑阻力。具体来说,基准线为26周期最高最低价中点,转向线为9周期最高最低价中点,而云带的上轨线和下轨线分别为转向线和基准线的中点,以及52周期最高最低价中点。当价格在云带上方时为多头行情,下方为空头行情。
双指数移动平均线部分,13周期指数移动平均线代表短期趋势,21周期指数移动平均线代表中期趋势。当13EMA在21EMA之上时为多头行情,之下为空头行情。
根据Ichimoku云带与双EMA的组合判断,可以实现比较准确的趋势判断。具体交易策略为,多头入场时,要求价格高于延迟线,13EMA高于基准线和21EMA,并且价格位于云带之上。空头入场要求则为价格低于延迟线,13EMA低于基准线和21EMA,价格位于云带之下。
通过云带判断大趋势,双EMA判断短期动量,延迟线Used as a filter against whipsaws. 这样多重条件综合判断,可以有效过滤假突破,确保交易信号的可靠性。
策略优势
该策略具有以下几个优势:
多时间框架综合判断。云带判断中长期趋势,双EMA判断短期动量,实现了多时间维度的组合,提高判断准确性。
有效过滤假突破。入场条件较为严格,需要价格、云带、延迟线、双EMA多个指标同向发出信号,可以过滤掉大部分噪音。
策略参数经过优化。如9周期转向线和26周期基准线等参数选择,使信号更加可靠。
适用于高波动的股票和数字货币。Ichimoku云带对跳空缺口等价格异常不敏感,更适合波动较大的交易品种。
绘制清晰的支撑阻力。云带可以清楚地显示关键的支撑和阻力区域。
风险分析
该策略也存在一些风险:
在震荡行情中可能产生错乱交易信号。当价格在中期无明确趋势时,云带将发散,此时信号可靠性较差。
延迟线可能错过价格反转时点。当快速反转发生时,延迟线检测可能慢半拍,导致损失扩大。
需要判断多个指标,增加了交易难度。这要求交易者需要对各个指标都有深入的理解,否则难以准确判断。
首次突破云带容易被套。当价格长期被云带限制后首次突破时,容易形成套牢的局面。
回测数据拟合风险。当前参数经过多次优化拟合,可能对特定回测数据过于依赖。实盘中SIGNALS MAY DETERIORATE.
这些风险可以通过以下几点得到缓解:
在震荡趋势中降低仓位。根据ATR和波动率评估市场波动率,必要时考虑仅做轻仓交易。
结合其他指标过滤延迟线信号。可以引入MACD,RSI等辅助指标对延迟线信号进行二次校验。
做好持续回测。修改回测时间和品种,检查策略稳健性。同时引入滑点、手续费等真实交易因素。
实盘连续跟踪,记录异常情况。实盘观察云带与价格运动的匹配情况,记录策略表现,作为后续改进参考。
策略优化
该策略可以从以下几个方面进行优化:
引入止损策略。建议引入滑点止损、突破新高(新低)止损等策略,严格控制风险。
优化移动均线参数。可以测试更多的EMA周期参数组合,找到更匹配的多空周期。
增加其他指标过滤。可以测试引入MACD,KD,RSI等指标,对交易信号进行过滤,排除更多假信号。
根据市况调整仓位。可以建立波动率模型,在高波动时降低仓位;低波动时加大仓位。
测试不同品种参数健壮性。修改回测品种和时间段,检查策略在不同市场中的稳定性。
通过这些优化,可以进一步提升策略的稳定性和信号质量,减少曲线拟合风险,使策略的参数和规则更加健壮。
总结
该Ichimoku云带与双EMA交叉策略,融合了 Ichimoku云带的趋势判断能力与EMA的短期预测能力,形成了一套较为完整的多时间框架交易体系。在多空条件判断上比较严格,包含价格本身、云带位置、延迟线、双EMA多种指标,可以有效过滤假信号。但也应注意震荡行情下的风险,此时应结合更多指标二次校验。总体而言,该策略成功结合了趋势跟踪和短期预测两大核心能力,值得深入研究与运用。
/*backtest
start: 2022-12-19 00:00:00
end: 2023-12-25 00:00:00
period: 1d
basePeriod: 1h
exchanges: [{"eid":"Futures_Binance","currency":"BTC_USDT"}]
*/

//@version=3
strategy("13/21 EMA + Ichimoku Kinko Hyo Strategy", shorttitle="EMI", overlay=true, default_qty_type=strategy.percent_of_equity, max_bars_back=1000, default_qty_value=100, calc_on_order_fills= true, calc_on_every_tick=true, pyramiding=0)

TenkanSenPeriods = input(9, minval=1, title="Tenkan Sen Periods")
KijunSenPeriods = input(26, minval=1, title="Kijun Sen Periods")
SenkouSpanBPeriods = input(52, minval=1, title="Senkou Span B Periods")
displacement = input(26, minval=1, title="Displacement")
donchian(len) => avg(lowest(len), highest(len))
TenkanSen = donchian(TenkanSenPeriods)
KijunSen = donchian(KijunSenPeriods)
SenkouSpanA = avg(TenkanSen, KijunSen)
SenkouSpanB = donchian(SenkouSpanBPeriods)
ChikouSpan = close[displacement-1]

Sema = ema(close, 13)
Mema = ema(close, 21)
Lema = ema(close, 89)
XLema = ema(close, 233)

plot(Sema, color=blue, title="13 EMA", linewidth = 2)
plot(Mema, color=fuchsia, title="21 EMA", linewidth = 1)
plot(Lema, color=orange, title="89 EMA", linewidth = 2)
plot(XLema, color=teal, title="233 EMA", linewidth = 2)
plot(KijunSen, color=maroon, title="Kijun Sen", linewidth = 3)
plot(close, offset = -displacement, color=lime, title="Chikou Span", linewidth = 2)
sa=plot (SenkouSpanA, offset = displacement, color=green,  title="Senkou Span A", linewidth = 1)
sb=plot (SenkouSpanB, offset = displacement, color=red,  title="Senkou Span B", linewidth = 3)
fill(sa, sb, color = SenkouSpanA > SenkouSpanB ? green : red)

longCondition = close>ChikouSpan and Sema>KijunSen and Sema>Mema and SenkouSpanA>SenkouSpanB
strategy.entry("Long",strategy.long,when = longCondition)
strategy.close("Long", when = (close<KijunSen and close<ChikouSpan and Sema<Mema))

shortCondition = close<ChikouSpan and Sema<KijunSen and Sema<Mema and SenkouSpanA<SenkouSpanB
strategy.entry("Short",strategy.short, when = shortCondition)
strategy.close("Short", when = (close>KijunSen and close>ChikouSpan and Sema>Mema))