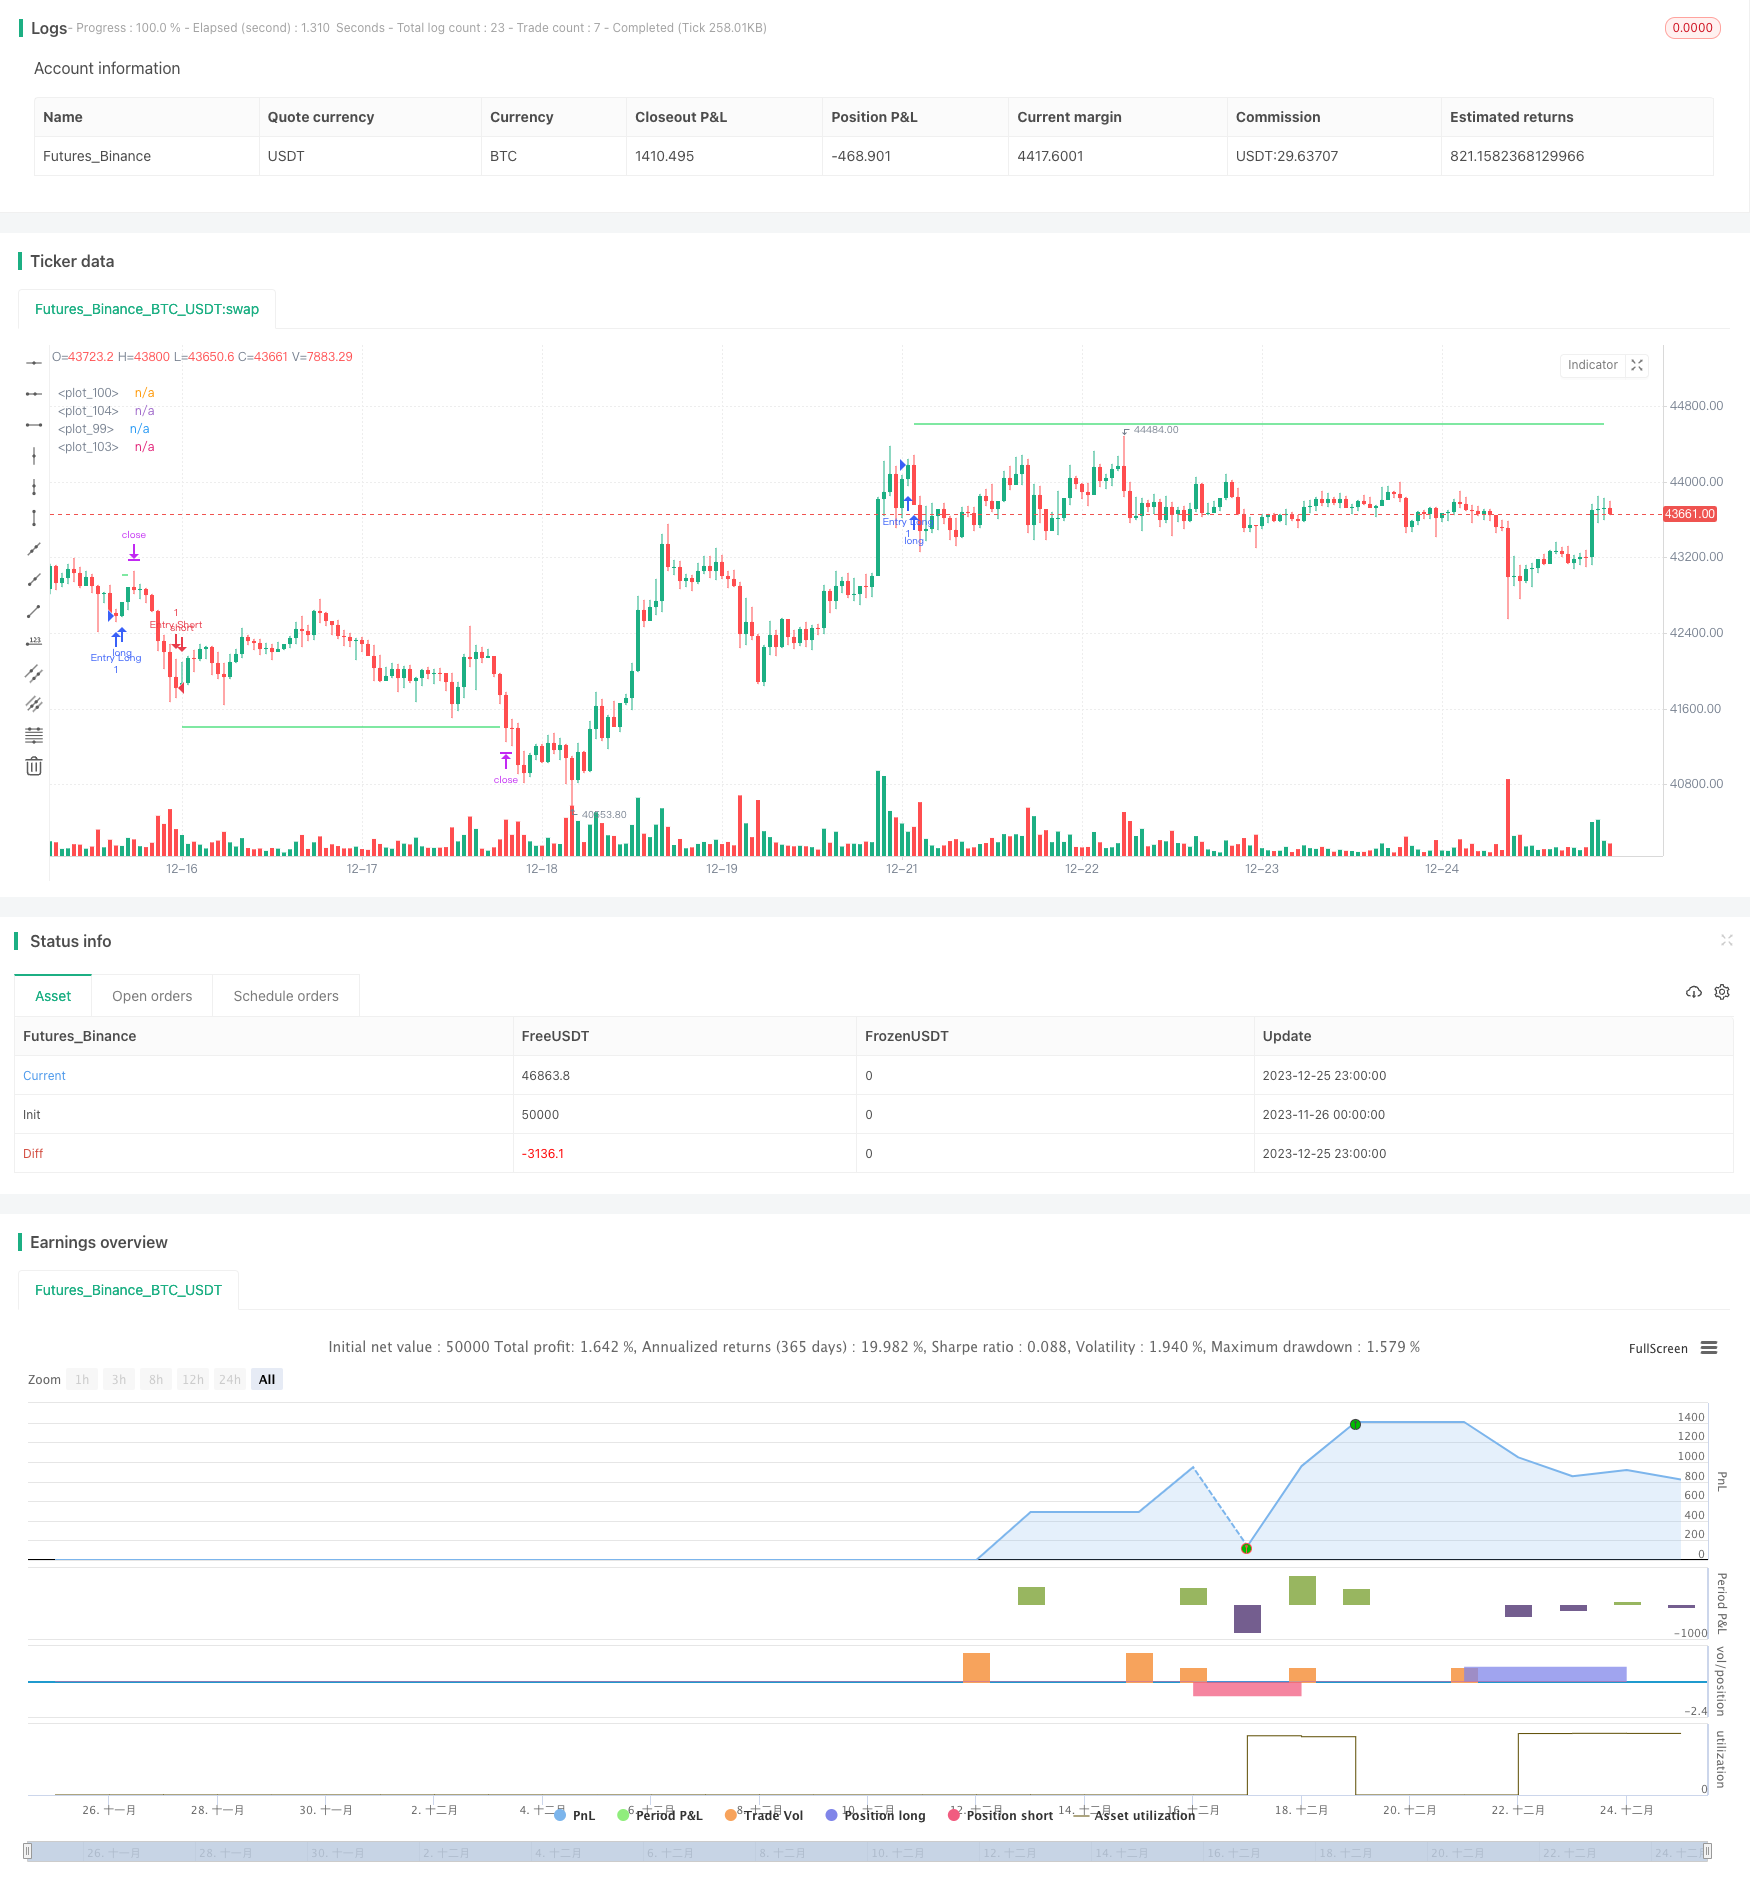
概述
本策略通过比较 MACD 指标的快线和慢线的交叉来产生买入和卖出信号。在产生买入信号时,会按一定比例占用账户权益进行买入开仓。之后会在特定回撤点追加仓位。当仓位盈利达到配置的止盈点时,会全部卖出平仓。卖出信号和买入信号逻辑类似。
策略原理
本策略的核心逻辑是比较 MACD 快线和慢线的交叉来判断趋势。MACD 是移动平均线的差值,通过计算短期和长期平均线之间的差值,来判断市场趋势和能量。快线和慢线交叉是金叉和死叉。
当快线上穿慢线时,产生金叉,表示市场处于看涨趋势,这时策略会开仓做多;当快线下穿慢线时,产生死叉,表示看跌趋势,这时策略会开仓做空。
在开仓后,策略会在特定回撤点追加做多或做空仓位。这可以通过马丁格尔原理增加盈利空间。当仓位累计盈利达到配置的止盈点后,策略会全部卖出或买入平仓。
优势分析
本策略具有以下优势:
使用 MACD 指标判断市场趋势,这是一种经典且可靠的技术分析指标。
采用分批开仓的方式,可以控制单笔交易风险。
追加开仓可以通过马丁格尔原理扩大盈利空间。
配置止盈点来限制亏损。
风险分析
本策略也存在一定的风险:
MACD 指标并不能完美预测市场走势,可能出现错误信号。
全仓追加仓位存在回撤扩大的风险。可以适当调整每次追加的仓位百分比。
止盈点设置过小可能导致盈利空间受限。可以根据不同品种调整。
需要合理配置开仓资金比例,以免单个品种交易超过账户限制。
优化方向
本策略可以从以下几个方面进行优化:
测试不同参数的 MACD 指标,找到对特定交易品种更加适合的指标参数。
优化每次追加开仓的资金百分比和回撤幅度参数,找到最优参数组合。
分别测试长线和短线操作止盈点参数,确定最优止盈水平。
评估账户加仓能力,设定合理的单品种最大仓位限制。
增加止损逻辑。当市场发生剧烈变动是,止损可以有效控制亏损。
总结
本策略总体来说是一个典型的趋势跟踪策略。它利用 MACD 指标判断市场趋势方向,采取分批加仓的方式跟踪趋势,在盈利达到一定水平后止盈离场。这种策略简单实用,容易实现,适合量化交易初学者。通过参数优化和风控逻辑扩展,可以使策略更加稳健。
/*backtest
start: 2023-11-26 00:00:00
end: 2023-12-26 00:00:00
period: 1h
basePeriod: 15m
exchanges: [{"eid":"Futures_Binance","currency":"BTC_USDT"}]
*/

// This source code is subject to the terms of the Mozilla Public License 2.0 at https://mozilla.org/MPL/2.0/
// © TradingSoft_tech

//@version=5
strategy("MAPM-V1", overlay=true, default_qty_value=10, max_bars_back=5000,default_qty_type = strategy.percent_of_equity, commission_value=0.1, initial_capital = 100, pyramiding=6, currency=currency.USD)

///////// Options
SignalFast = input.int(300, step=10)
SignalSlow = input.int(600, step=10)
StepAddPurchases = input.float(2.5, step=0.1)
VolumePurchases = input.int(6,step=1)
Buy = input(true)
Sell = input(true)
longProfitPerc = input.float(title="Long Take Profit (%)", minval=0.0, step=0.1, defval=1) * 0.01
shortProfitPerc = input.float(title="Short Take Profit (%)", minval=0.0, step=0.1, defval=1) * 0.01
Martingale = input.float(1.6, minval = 1, step = 0.1)
VolumeDepo = input.int(100, step=1)
PercentOfDepo = input.float(10, step=1)
Close = (close)
EnterVolume = VolumeDepo*PercentOfDepo*0.01/Close

///////// Calculation indicator
fastAverage = ta.ema(close, 8)
slowAverage = ta.ema(close, 49)
macd = fastAverage - slowAverage
macdSignalF = ta.ema(macd,SignalFast)
macdSignalS = ta.ema(macd,SignalSlow)

// Test Start
startYear = input(2005, "Test Start Year")
startMonth = input(1, "Test Start Month")
startDay = input(1, "Test Start Day")
startTest = timestamp(startYear,startMonth,startDay,0,0)

//Test End
endYear = input(2050, "Test End Year")
endMonth = input(12, "Test End Month")
endDay = input(30, "Test End Day")
endTest = timestamp(endYear,endMonth,endDay,23,59)

timeRange = time > startTest and time < endTest ? true : false

///////// Plot Data
//plot(macd, style = plot.style_histogram)
//plot(macdSignalF*10000, style = plot.style_line, color=color.red)
//plot(macdSignalS*10000, style = plot.style_line, color=color.blue)
//plot(fastAverage, style = plot.style_line, color=color.red)
//plot(slowAverage, style = plot.style_line, color=color.blue)

///////// Calculation of the updated value
var x = 0.0
if strategy.opentrades>strategy.opentrades[1]
    x := x + 1
else if strategy.opentrades==0
    x := 0
y = x+1

///////// Calculation of reference price data
entryPrice = strategy.opentrades==0? 0 : strategy.opentrades.entry_price(0)
limitLong = strategy.position_avg_price * (1 + longProfitPerc)
limitShort = strategy.position_avg_price * (1 - shortProfitPerc)
SteplimitLong = entryPrice[0]*(1-StepAddPurchases*y/100)
SteplimitShort = entryPrice[0]*(1+StepAddPurchases*y/100)

///////// Conditions for a long
bool EntryLong = ta.crossover(macdSignalF, macdSignalS) and Buy and strategy.opentrades==0 and strategy.position_size==0
bool PurchasesLong = Buy and strategy.opentrades==x and strategy.position_size>0 and x<=VolumePurchases
bool CancelPurchasesLong = strategy.position_size==0 and strategy.opentrades==0
bool TPLong = strategy.position_size>0 and strategy.opentrades!=0
///////// Entry Long + add.purchases + cancel purchases + Take profit Long
switch
    EntryLong => strategy.entry("Entry Long", strategy.long, qty = EnterVolume)
    PurchasesLong => strategy.entry("PurchasesLong", strategy.long, qty = EnterVolume*math.pow(Martingale,y), limit = SteplimitLong)
    CancelPurchasesLong => strategy.cancel("PurchasesLong")
switch
    TPLong => strategy.exit("TPLong", qty_percent = 100, limit = limitLong)

///////// Conditions for a Short
bool EntryShort = ta.crossunder(macdSignalF, macdSignalS) and Sell and strategy.opentrades==0 and strategy.position_size==0
bool PurchasesShort = Sell and strategy.opentrades==x and strategy.position_size<0 and x<=VolumePurchases
bool CancelPurchasesShort = strategy.position_size==0 and strategy.opentrades==0
bool TPShort = strategy.position_size<0 and strategy.opentrades!=0

///////// Entry Short + add.purchases + cancel purchases + Take profit Short
switch
    EntryShort => strategy.entry("Entry Short", strategy.short, qty = EnterVolume)
    PurchasesShort => strategy.entry("PurchasesShort", strategy.short, qty = EnterVolume*math.pow(Martingale,y), limit = SteplimitShort)
    CancelPurchasesShort => strategy.cancel("PurchasesShort")
switch
    TPShort => strategy.exit("TPShort", qty_percent = 100, limit = limitShort)

/////////Calculation of conditions and reference data for level drawing
InTradeLong = strategy.position_size<0
InTradeShort = strategy.position_size>0
PickInLong = strategy.opentrades.entry_price(0)*(1-StepAddPurchases*y/100)
PickInShort = strategy.opentrades.entry_price(0)*(1+StepAddPurchases*y/100)

/////////Displaying the level of Take Profit
plot(InTradeLong ? na : limitLong, color=color.new(#00d146, 0), style=plot.style_linebr, linewidth=1)
plot(InTradeShort ? na : limitShort, color=color.new(#00d146, 0), style=plot.style_linebr, linewidth=1)

/////////Displaying the level of add.purchases
plot(InTradeLong ? na : PickInLong, color=color.white, style=plot.style_linebr, linewidth=1)
plot(InTradeShort ? na : PickInShort, color=color.white, style=plot.style_linebr, linewidth=1)