资源加载中... loading...

Short-Term Silver Trading Strategy Based on SMA and RSI Indicators

Author: ChaoZhang, Date: 2023-12-27 16:42:05
Tags:

img

Overview

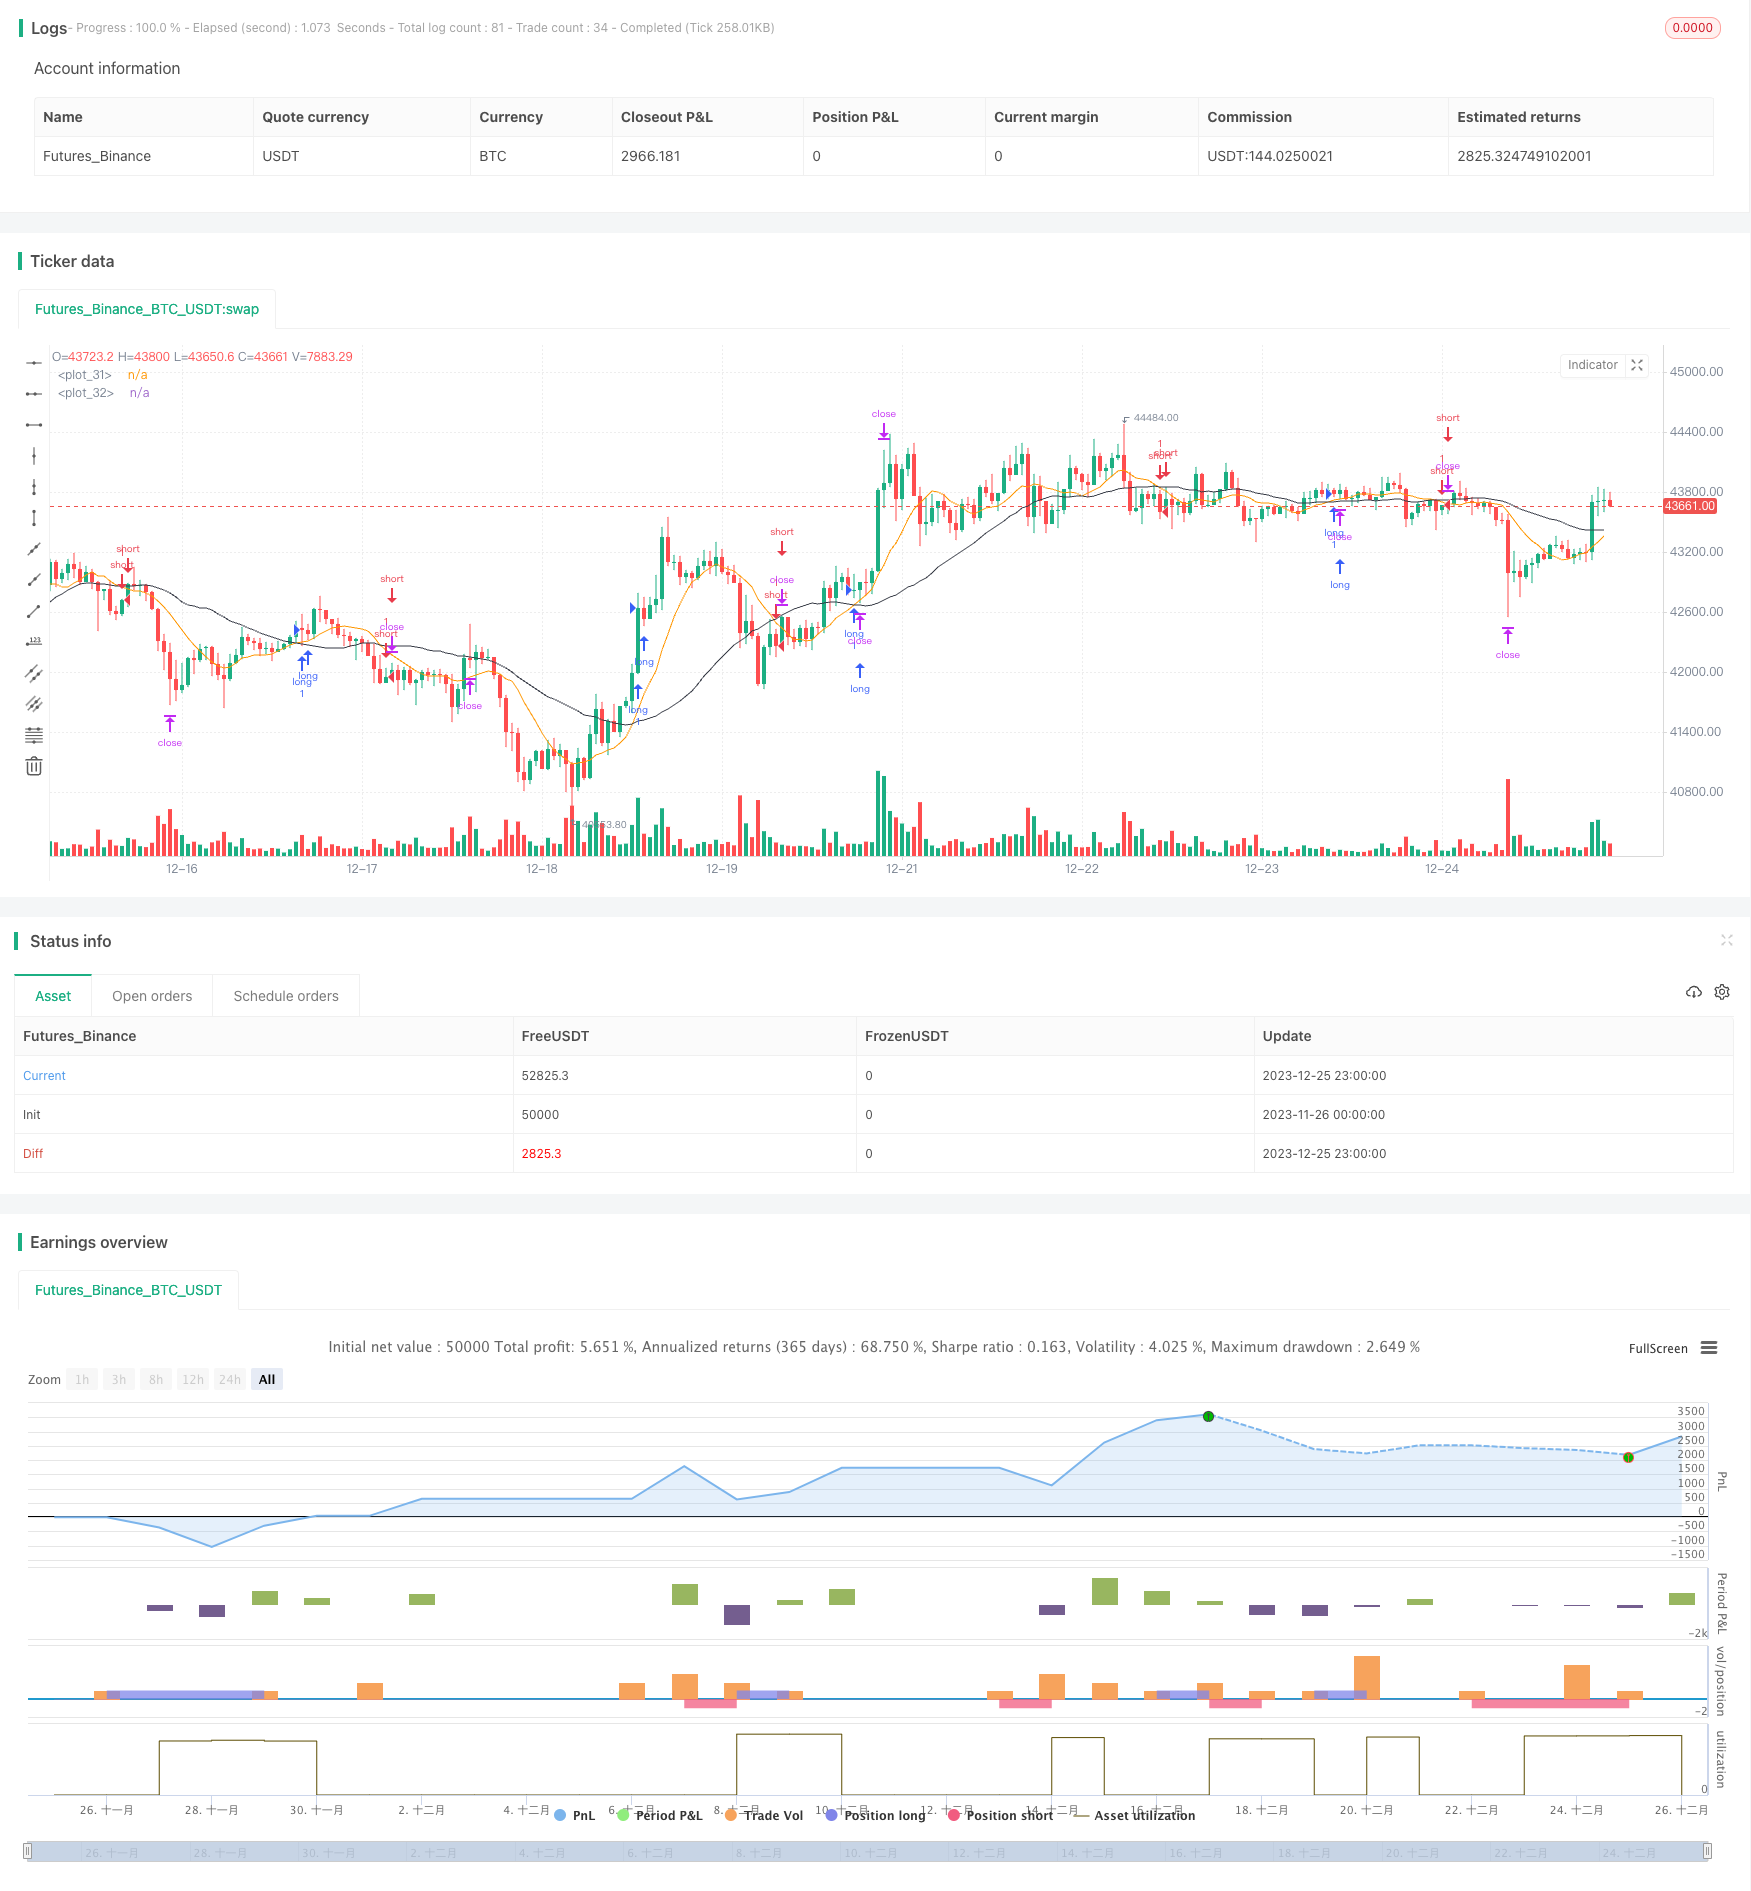
This strategy is based on the 10-day simple moving average (SMA), 30-day SMA and relative strength index (RSI) indicator, combined with the average true range (ATR) indicator to set stop loss and take profit levels for short-term silver trading. It is suitable for 1-hour timeframe operations.

Strategy Logic

When the 10-day SMA crosses above the 30-day SMA, it signals an uptrend in price in the short term. A long position is taken when RSI is above 50. When the 10-day SMA crosses below the 30-day SMA, it signals a downtrend in price in the short term. A short position is taken when RSI is below 50.

The stop loss level is set at the recent low minus 3 times ATR. The take profit level is set at the recent high plus 3 times ATR. This utilizes the characteristics of the ATR indicator to have wider stops when volatility increases and narrower stops when volatility decreases, thereby controlling risk.

Advantage Analysis

This strategy combines multiple indicators to determine short-term trend and capital inflows/outflows, which can effectively filter false signals. At the same time, the ATR stop loss mechanism allows stop levels to be dynamically adjusted to control risk.

Compared to long-term trading strategies, short-term operations have advantages like fast capital turnover and frequent position opening. This strategy uses the 1-hour moving average system to determine short-term trend changes and the RSI indicator to determine entry and exit timing, which can capture short-term price rises and falls.

Risks and Mitigations

The main risks this strategy faces are stop loss being hit, frequent stop outs in uptrends etc. To mitigate these risks, the ATR multiplier can be adjusted or price filters can be added to avoid stops being hit. At the same time, locking or adding to positions is recommended to reduce frequent stop outs in uptrends.

In addition, short-term trading requires high psychological endurance from traders, so risks like overtrading and emotional decisions should be avoided. It is recommended that traders control position sizing appropriately and establish strict risk management rules.

Optimization Directions

This strategy can be further optimized in the following ways:

  1. Add other indicators for filtration, like the KDJ indicator to determine overbought and oversold conditions
  2. Test different parameter combinations, like SMA periods, ATR multiplier, RSI threshold etc.
  3. Incorporate machine learning algorithms to dynamically optimize the parameters
  4. Expand this pattern to other assets using basket trading techniques
  5. Add automatic stop loss module to dynamically trail the stop levels

Summary

This strategy integrates multiple indicators to determine short-term trends and capital flows, and optimizes the stop loss mechanism using the ATR indicator. It has advantages like fast capital turnover and frequent position opening, making it suitable for short-term trading of assets like silver. We still need to guard against risks like overtrading and emotional decisions, and continue optimizing the strategy to improve robustness and win rate.


/*backtest
start: 2023-11-26 00:00:00
end: 2023-12-26 00:00:00
period: 1h
basePeriod: 15m
exchanges: [{"eid":"Futures_Binance","currency":"BTC_USDT"}]
*/

// This Pine Script™ code is subject to the terms of the Mozilla Public License 2.0 at https://mozilla.org/MPL/2.0/
// © kapshamam

//@version=5
strategy("SMA 10 30 ATR RSI", overlay=true)

// Create Indicator's
shortSMA = ta.sma(close, 10)
longSMA = ta.sma(close, 30)
rsi = ta.rsi(close, 14)
atr = ta.atr(14)

// Specify crossover conditions
longCondition = ta.crossover(shortSMA, longSMA)
shortCondition = ta.crossunder(shortSMA, longSMA)

// Execute trade if condition is True
if (longCondition)
    stopLoss = low - atr * 3
    takeProfit = high + atr * 3
    strategy.entry("long", strategy.long, 1, when = rsi > 50)
    strategy.exit("exit", "long", stop=stopLoss, limit=takeProfit)

if (shortCondition)
    stopLoss = high + atr * 2
    takeProfit = low - atr * 2
    strategy.entry("short", strategy.short, 1, when = rsi < 50)
    strategy.exit("exit", "short", stop=stopLoss, limit=takeProfit)

// Plot Moving Average's to chart
plot(shortSMA)
plot(longSMA, color=color.black)
template: strategy.tpl:40:21: executing "strategy.tpl" at <.api.GetStrategyListByName>: wrong number of args for GetStrategyListByName: want 7 got 6