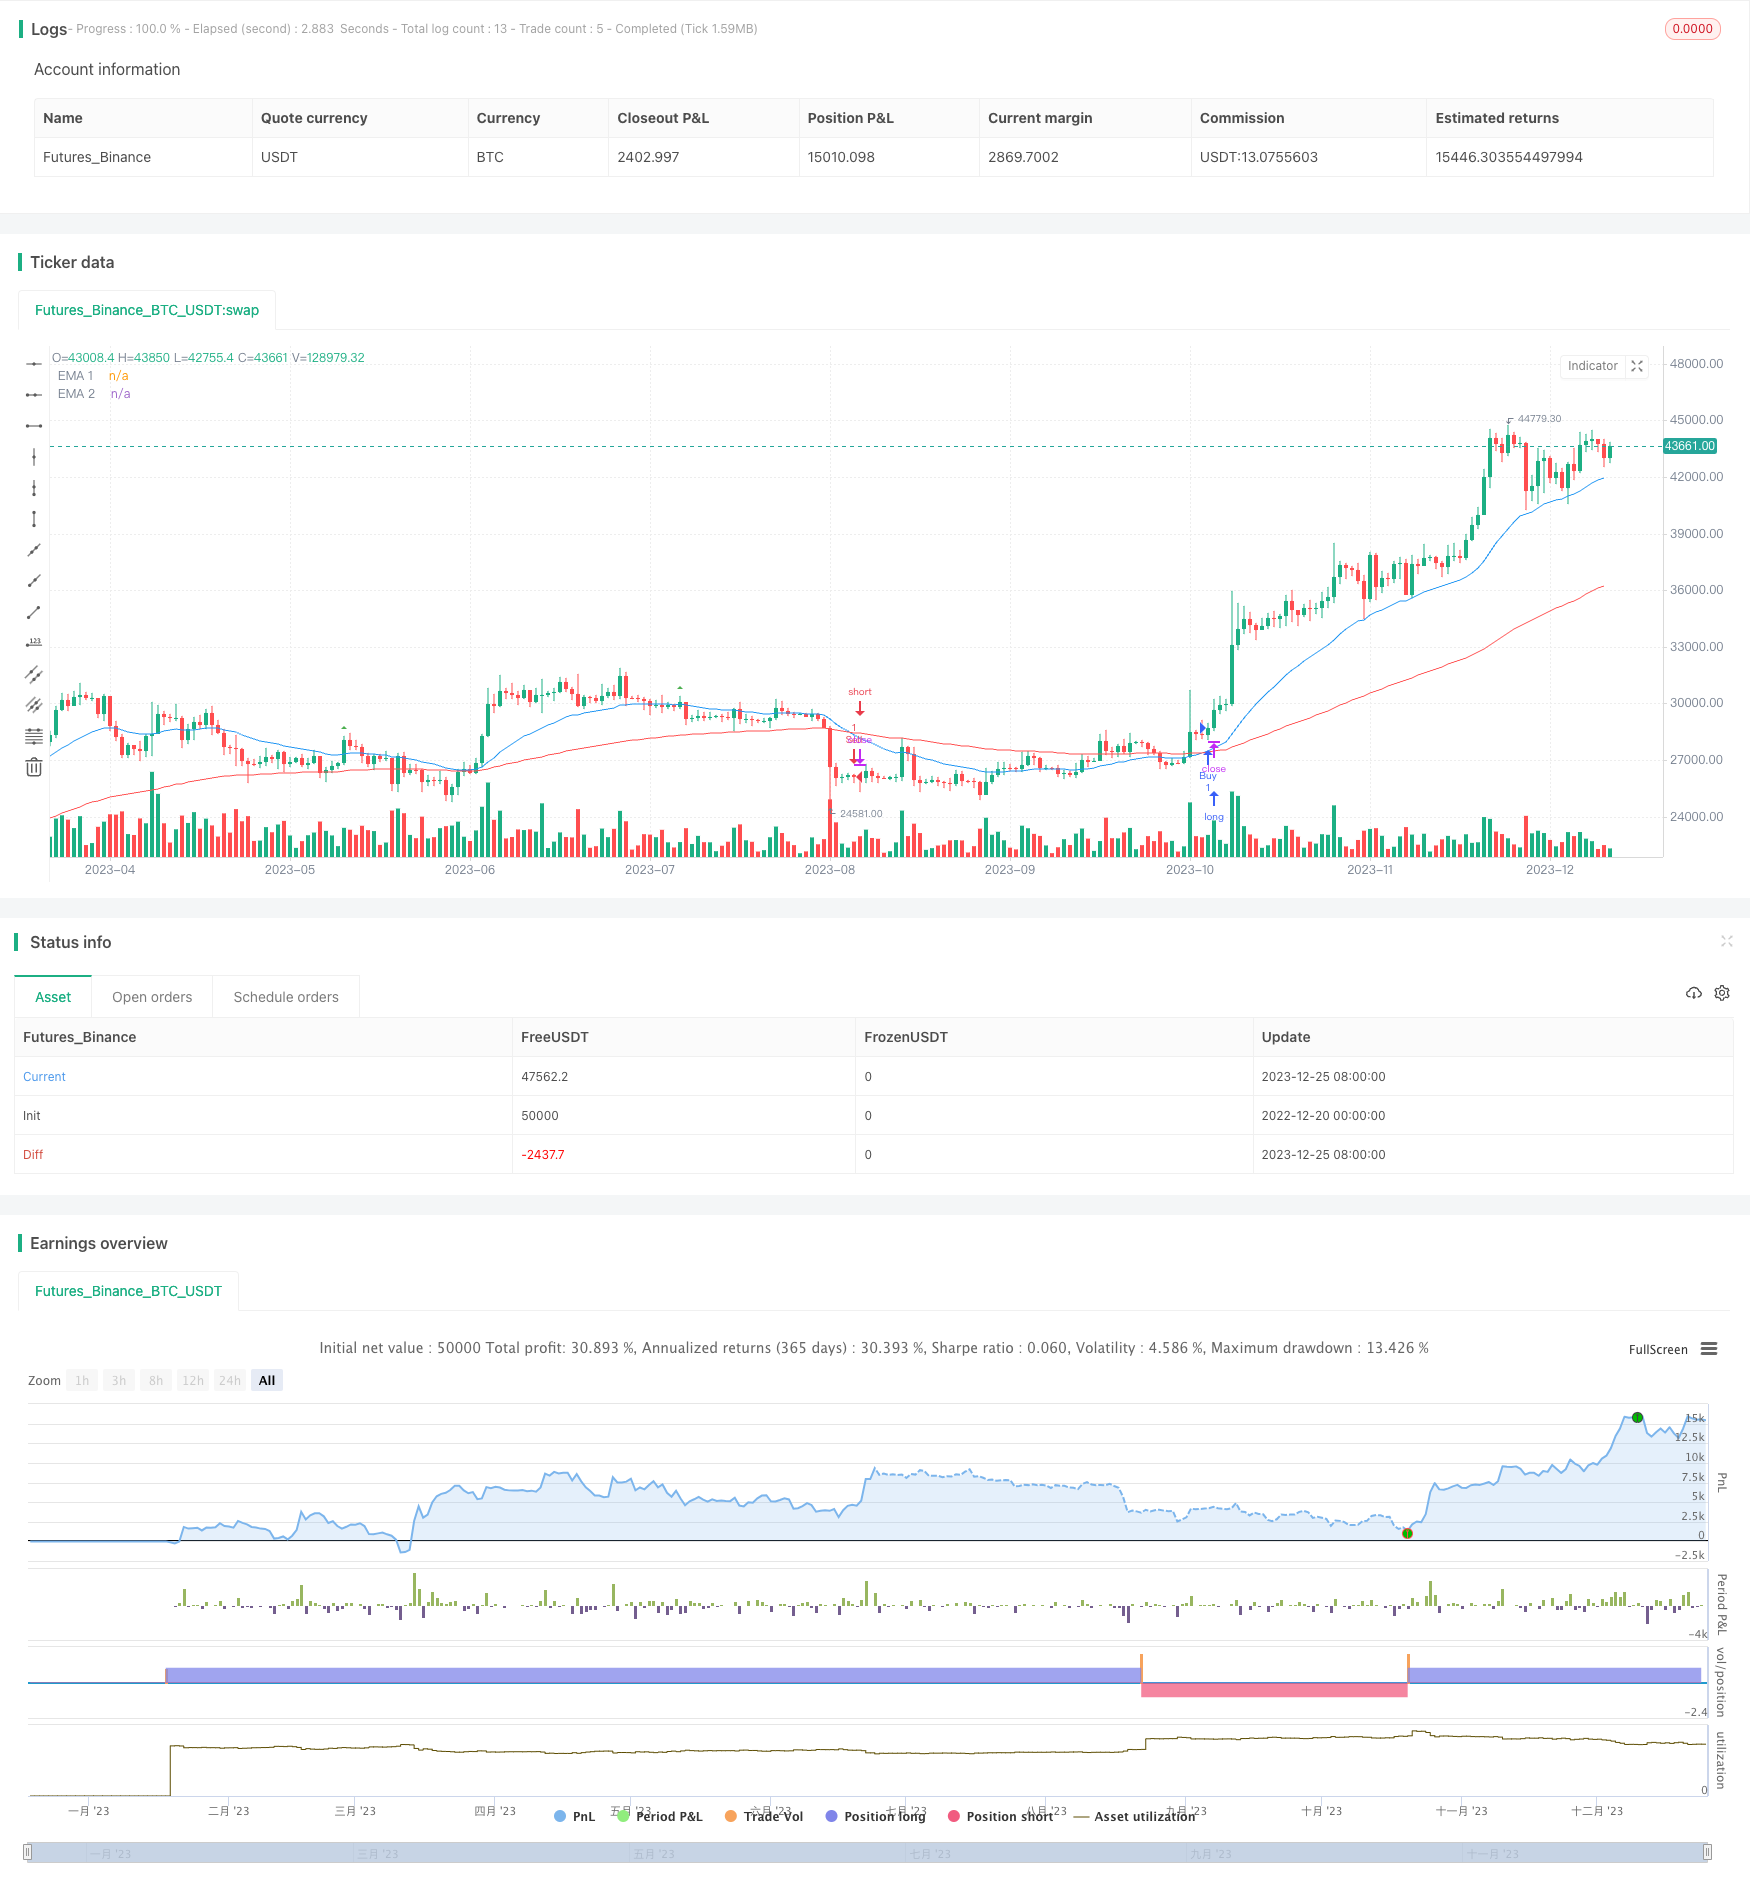
概述
动量指标交叉策略(Momentum Indicator Crossover Strategy)是一个结合指数移动平均线(Exponential Moving Average,EMA)和相对强弱指标(Relative Strength Index,RSI)信号的交易方法。该策略旨在利用两条EMA线的交叉产生买入和卖出信号,从而在金融市场中进行交易。
策略原理
该策略的核心是EMA的快慢线交叉系统。策略中定义了三条不同参数的EMA线:ema1、ema2和ema3。其中,ema1代表短期趋势,ema2代表中期趋势,ema3代表长期趋势。当短期趋势上穿中期趋势时,产生买入信号;当短期趋势下穿中期趋势时,产生卖出信号。
为过滤错诊信号,策略还定义了两个附加条件:bodybar1 > bodybar2和close > entrybar(买入信号)或close < entrybar(卖出信号)。这确保最近两根K线的实体 길度关系符合信号方向,并且价格突破入场点,避免重复入场。
另外,策略结合RSI指标evalue,RSI高位区域用于定义超买信号,RSI低位区域用于定义超卖信号。这有助于避免在价格过热和过冷的市场中产生错误信号。
优势分析
该策略具有以下优势:
- 使用方法简单易行,用户无需掌握复杂指标就可以使用。
- 可以根据投入资金的百分比灵活调整仓位大小。
- EMA交叉结合RSI过滤,可以提高信号的可靠性。
- 交易逻辑清晰,易于理解和调整。
风险分析
该策略也存在以下风险:
- EMA交叉并不能完全过滤市场噪音,容易产生假信号。
- 固定参数的EMA线无法实时适应市场变化。
- 没有止损逻辑,无法控制单笔损失。
- RSI过滤条件单一,可能错过部分机会。
优化方向
该策略可以从以下几个方向进行优化:
- 基于市场波动率和交易品种设定自适应EMA参数,提高参数的实时性。
- 结合其他指标如MACD、布林带等进行多重过滤,减少假信号。
- 增加跟踪止损、获利止盈功能,控制交易风险。
- 优化RSI的过滤逻辑,提高策略整体稳定性。
- 结合机器学习技术动态优化策略参数。
总结
动量指标交叉策略整合了EMA和RSI的优势,基于指标交叉形成交易信号。该策略简单实用,适合初学者使用,也可根据实际需要进行扩展和优化,提升策略效果。通过严格的风险管理,该策略有望取得稳定的超额收益。
策略源码
/*backtest
start: 2022-12-20 00:00:00
end: 2023-12-26 00:00:00
period: 1d
basePeriod: 1h
exchanges: [{"eid":"Futures_Binance","currency":"BTC_USDT"}]
*/

//@version=5
strategy('EMA Crossover Strategy', shorttitle='EMA Crossover', overlay=true)


// Define input for position size as a percentage of equity
position_size_pct = input(1, title='Position Size (%)') / 100

//Input EMA
len1 = input.int(25, minval=1, title='EMA 1')
src1 = input(close, title='Source')
ema1 = ta.ema(src1, len1)
len2 = input.int(100, minval=1, title='EMA 2')
src2 = input(close, title='Source')
ema2 = ta.ema(src2, len2)
len3 = input.int(200, minval=1, title='EMA 3')
src3 = input(close, title='Source')
ema3 = ta.ema(src3, len3)
//End of format

//Format RSI
lenrsi = input(14, title='RSI length')
outrsi = ta.rsi(close,lenrsi)
//plot(outrsi, title='RSI', color=color.new(color.blue, 0), linewidth=1)

//hline(70, 'Overbought', color=color.red)
//hline(30, 'Oversold', color=color.green)
//End of format


bodybar1 = math.abs(close - open)
bodybar2 = math.abs(close[1] - open[1])
// Plot the EMAs
plot(ema1, color=color.new(color.blue, 0), title='EMA 1')
plot(ema2, color=color.new(color.red, 0), title='EMA 2')
//plot(ema3, color=color.new(#ffffff, 0), title='EMA 3')

// EMA Crossover conditions
emaCrossoverUp = ta.crossover(ema1, ema2)
emaCrossoverDown = ta.crossunder(ema1, ema2)

var entrybar = close  // Initialize entrybar with the current close


// Calculate crossovers outside of the if statements
emaCrossoverUpOccured = ta.crossover(close, ema1) and ema1 > ema2 and bodybar1 > bodybar2 and close > entrybar
emaCrossoverDownOccured = ta.crossunder(close, ema1) and ema1 < ema2 and bodybar1 > bodybar2 and close < entrybar

plotshape(series=emaCrossoverUpOccured, location=location.abovebar, color=color.new(color.green, 0), style=shape.triangleup, title='New Buy Order', size=size.tiny)
plotshape(series=emaCrossoverDownOccured, location=location.belowbar, color=color.new(color.red, 0), style=shape.triangledown, title='New Sell Order', size=size.tiny)

// Define trading logic with custom position size and RSI conditions
if emaCrossoverUp or emaCrossoverUpOccured
    strategy.entry('Buy', strategy.long)
    entrybar := close  // Update entrybar when entering a new buy position
    entrybar

if emaCrossoverDown or emaCrossoverDownOccured
    strategy.entry('Sell', strategy.short)
    entrybar := close  // Update entrybar when entering a new sell position
    entrybar