概述:本策略是基于均线交叉的经典交易策略,指标选用双均线,包括简单移动平均线(SMA)、指数移动平均线(EMA),线性加权移动平均线(VWMA)和震荡加权移动平均线(HMA)。
原理:策略的核心逻辑是双均线交叉。通过计算两个不同参数的均线,当快速均线上穿慢速均线时产生买入信号;当快速均线下穿慢速均线时产生卖出信号。均线交叉代表了价格的短期与长期趋势的转折。
优势分析:双均线交叉策略优点主要在于简单易操作,通过一个信号即可获知最基本的趋势判断,无须过多参数选择与调整,非常适合新手交易者。且不同类型的均线都有测试,可以选择不同的组合来优化。
风险分析:本策略的主要风险在于常见的均线交叉策略会有大量的虚假信号,从而导致小额获利多次平仓的问题,影响了整体收益。此外,固定快慢均线长度设置也会在某些周期下失效。
优化方向:1)尝试不同周期测试,确定最佳均线交叉周期组合。2)考虑引入第二组均线的参数以及 RSI 指标的辅助判断减少虚假信号。3)引入基于 MA 指标增量变化的条件判定而非简单交叉,得到更加可靠的交叉判断。
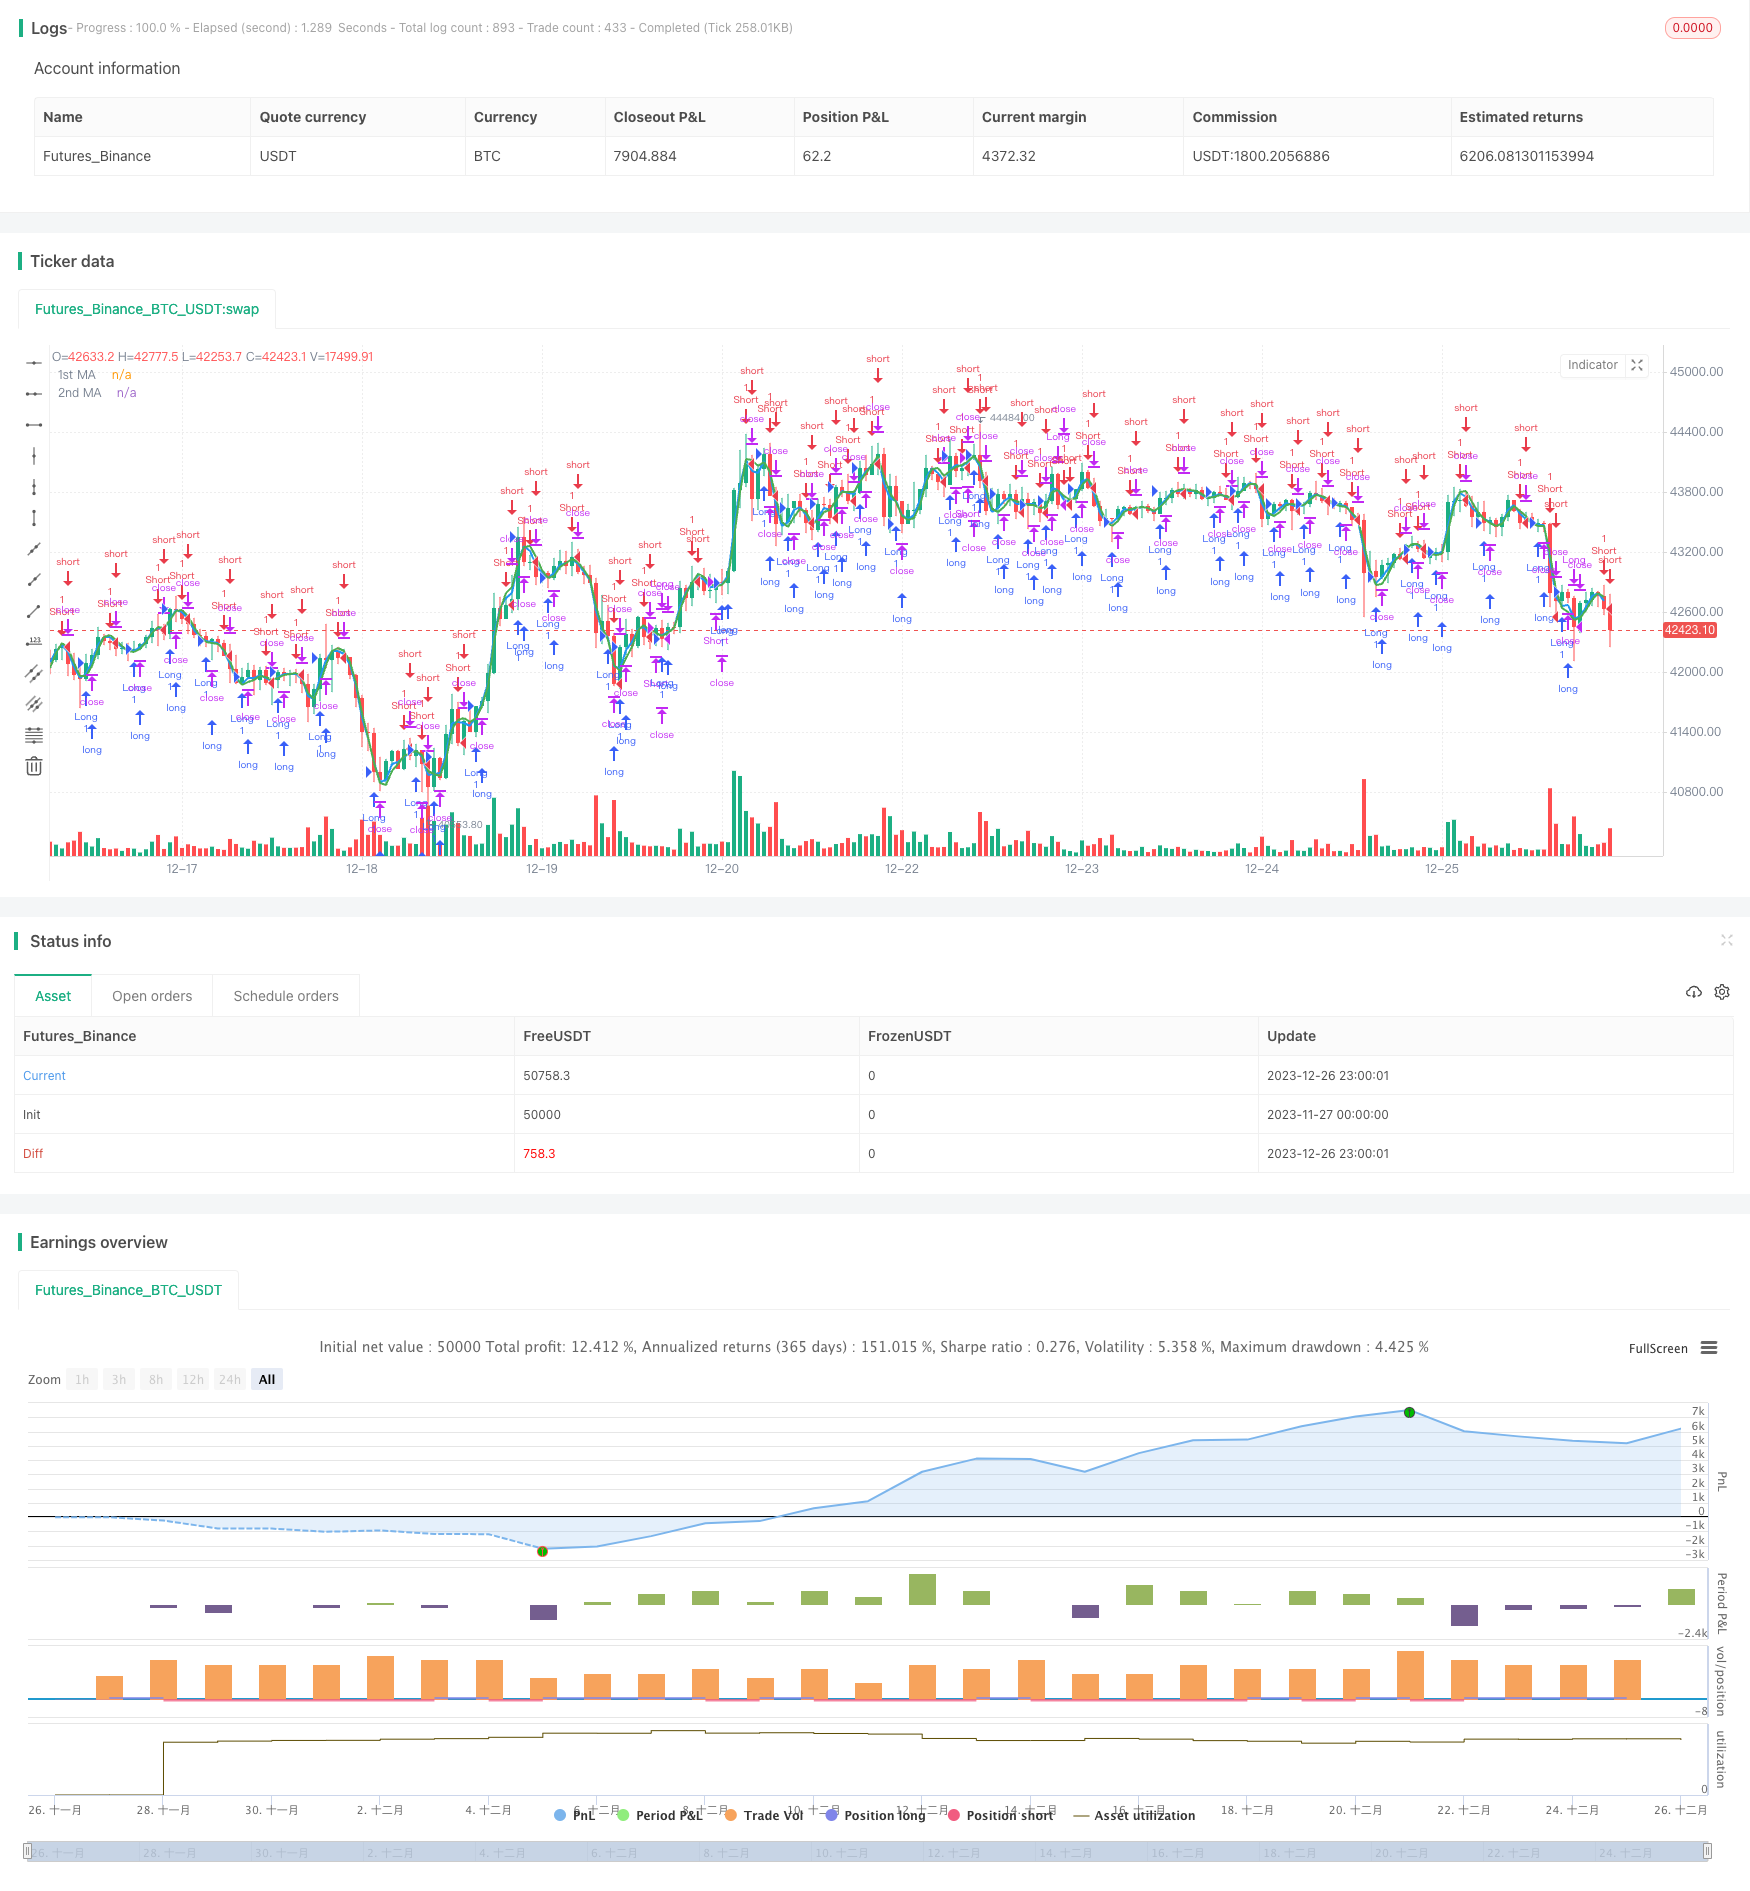
总结:本策略采用传统均线交叉策略的框架,进行双均线测试以找寻最佳均线周期组合,同时增加了基于均线 ROC 和价格的止损判定。总的来说是一个简单易用且符合量化交易逻辑的双均线策略。此外丰富的优化思路也为本策略的后继发展提供了空间。
策略源码
/*backtest
start: 2023-11-27 00:00:00
end: 2023-12-27 00:00:00
period: 1h
basePeriod: 15m
exchanges: [{"eid":"Futures_Binance","currency":"BTC_USDT"}]
*/

//@version=3
//study(title="MA Crossover Strategy", overlay = true)
strategy("MA Crossover Strategy with MA Turning Point Exits", overlay=true)
src = input(close, title="Source")

price = request.security(syminfo.tickerid, timeframe.period, src)
ma1 = input(5, title="1st MA Length")
type1 = input("HMA", "1st MA Type", options=["SMA", "EMA", "HMA", "VWMA"])

ma2 = input(7, title="2nd MA Length")
type2 = input("HMA", "2nd MA Type", options=["SMA", "EMA", "HMA", "VWMA"])

f_hma(_src, _length)=>
    _return = wma((2*wma(_src, _length/2))-wma(_src, _length), round(sqrt(_length)))
price1 = if (type1 == "SMA")
    sma(price, ma1)
else
    if (type1 == "EMA")
        ema(price, ma1)
    else
        if (type1 == "VWMA")
            vwma(price, ma1)
        else
            f_hma(price, ma1)

price2 = if (type2 == "SMA")
    sma(price, ma2)
else
    if (type2 == "EMA")
        ema(price, ma2)
    else
        if (type2 == "VWMA")
            vwma(price, ma2)
        else
            f_hma(price, ma2)

//plot(series=price, style=line,  title="Price", color=black, linewidth=1, transp=0)
plot(series=price1, style=line,  title="1st MA", color=blue, linewidth=2, transp=0)
plot(series=price2, style=line, title="2nd MA", color=green, linewidth=2, transp=0)


longCondition = crossover(price1, price2)
if (longCondition) // and time>timestamp(2018,6,1,9,30)
    strategy.entry("Long", strategy.long)

shortCondition = crossunder(price1, price2)
if (shortCondition) // and time>timestamp(2018,6,1,9,30)
    strategy.entry("Short", strategy.short)

lookback1 = input(1, "Lookback 1")
roc1 = roc(price1, lookback1)

ma1up = false
ma1down = false
ma2up = false
ma2down = false

ma1up := nz(ma1up[1])
ma1down := nz(ma1down[1])
ma2up := nz(ma2up[1])
ma2down := nz(ma2down[1])

trendStrength1 = input(2, title="Minimum slope magnitude * 100", type=float) * 0.01

if crossover(roc1, trendStrength1)
    ma1up := true
    ma1down := false

if crossunder(roc1, -trendStrength1)
    ma1up := false
    ma1down := true

shortexitCondition = ma1up and ma1down[1]
if (shortexitCondition)
    strategy.close("Short")

longexitCondition = ma1down and ma1up[1]
if (longexitCondition)
    strategy.close("Long")