概述
本策略基于移动平均线和成交量的技术指标,设计了一个长线追涨杀跌的量化策略。当股价站上20日线,并且该天的买量大于卖量且大于过去n天的平均成交量时,认为市场处于多头状态,该买入;当股价跌破下轨,并且该天卖量大于买量且大于过去n天的平均成交量时,认为市场处于空头状态,该卖出。
策略原理
该策略主要基于两个指标进行判断:
双均线:计算20日线和60日线,当20日线上穿60日线时,市场认为处于看涨状态;当20日线下穿60日线时,市场认为处于看跌状态。
成交量:计算每天的成交买量和卖量,如果买量大于卖量并且大于过去n天的平均成交量,则判断为多头行情;如果卖量大于买量并且大于过去n天的平均成交量,则判断为空头行情。
具体的交易策略和逻辑如下:
多头入场:当收盘价站上20日线,且该天买量大于卖量和过去n天的平均成交量时,认为市场处于看多状态,根据波动率计算出布林带,如果收盘价位于布林带中轨和下轨之间,则入场做多。
空头入场:当收盘价跌破下轨,且该天卖量大于买量和过去n天的平均成交量时,认为市场处于看空状态,根据波动率计算出布林带,如果收盘价小于布林带下轨,则入场做空。
止盈和止损:设定合理的止盈位和止损位,固定盈利或减少损失。如当股价比入场价大幅上涨5%时止盈;当亏损达到10%时止损;或者当股价创近期新高后回落一定幅度时止盈。
优势分析
该策略具有以下优势:
结合双均线和交易量指标,避免了单一技术指标判断的盲区。
采用不同参数的布林带确定具体的交易价格,使入场更加精确。
止盈止损策略合理,有利于锁定收益和控制风险。
回测效果良好,收益稳定,可实际运用于量化交易。
风险分析
该策略也存在一些风险:
双均线策略容易产生失误信号,需要结合量能指标进行过滤。
布林带参数设置不当可能导致入场过于频繁或稀疏。
固定止盈止损点设置不当,可能影响策略收益。
需要大量历史数据进行回测验证,实盘中仍可能出现意外损失。
优化方向
该策略可以从以下几个方面进行优化:
优化均线系统参数,寻找最佳均线组合。
优化布林带参数,使入场更加精准。
动态调整止盈止损点,根据市场情况设定合理盈亏比。
增加其他技术指标判断,如MACD、KD等,提高策略准确性。
利用机器学习方法自动寻优参数,使策略更具鲁棒性。
总结
本策略总体来说是一个非常实用的量化交易策略,回测表现良好,可谓易于实现,风险可控,是一种适合用于实盘的稳定策略,值得量化交易者借鉴学习。当然,策略优化空间仍然很大,期待有更多量化交易高手对其进行改进。
/*backtest
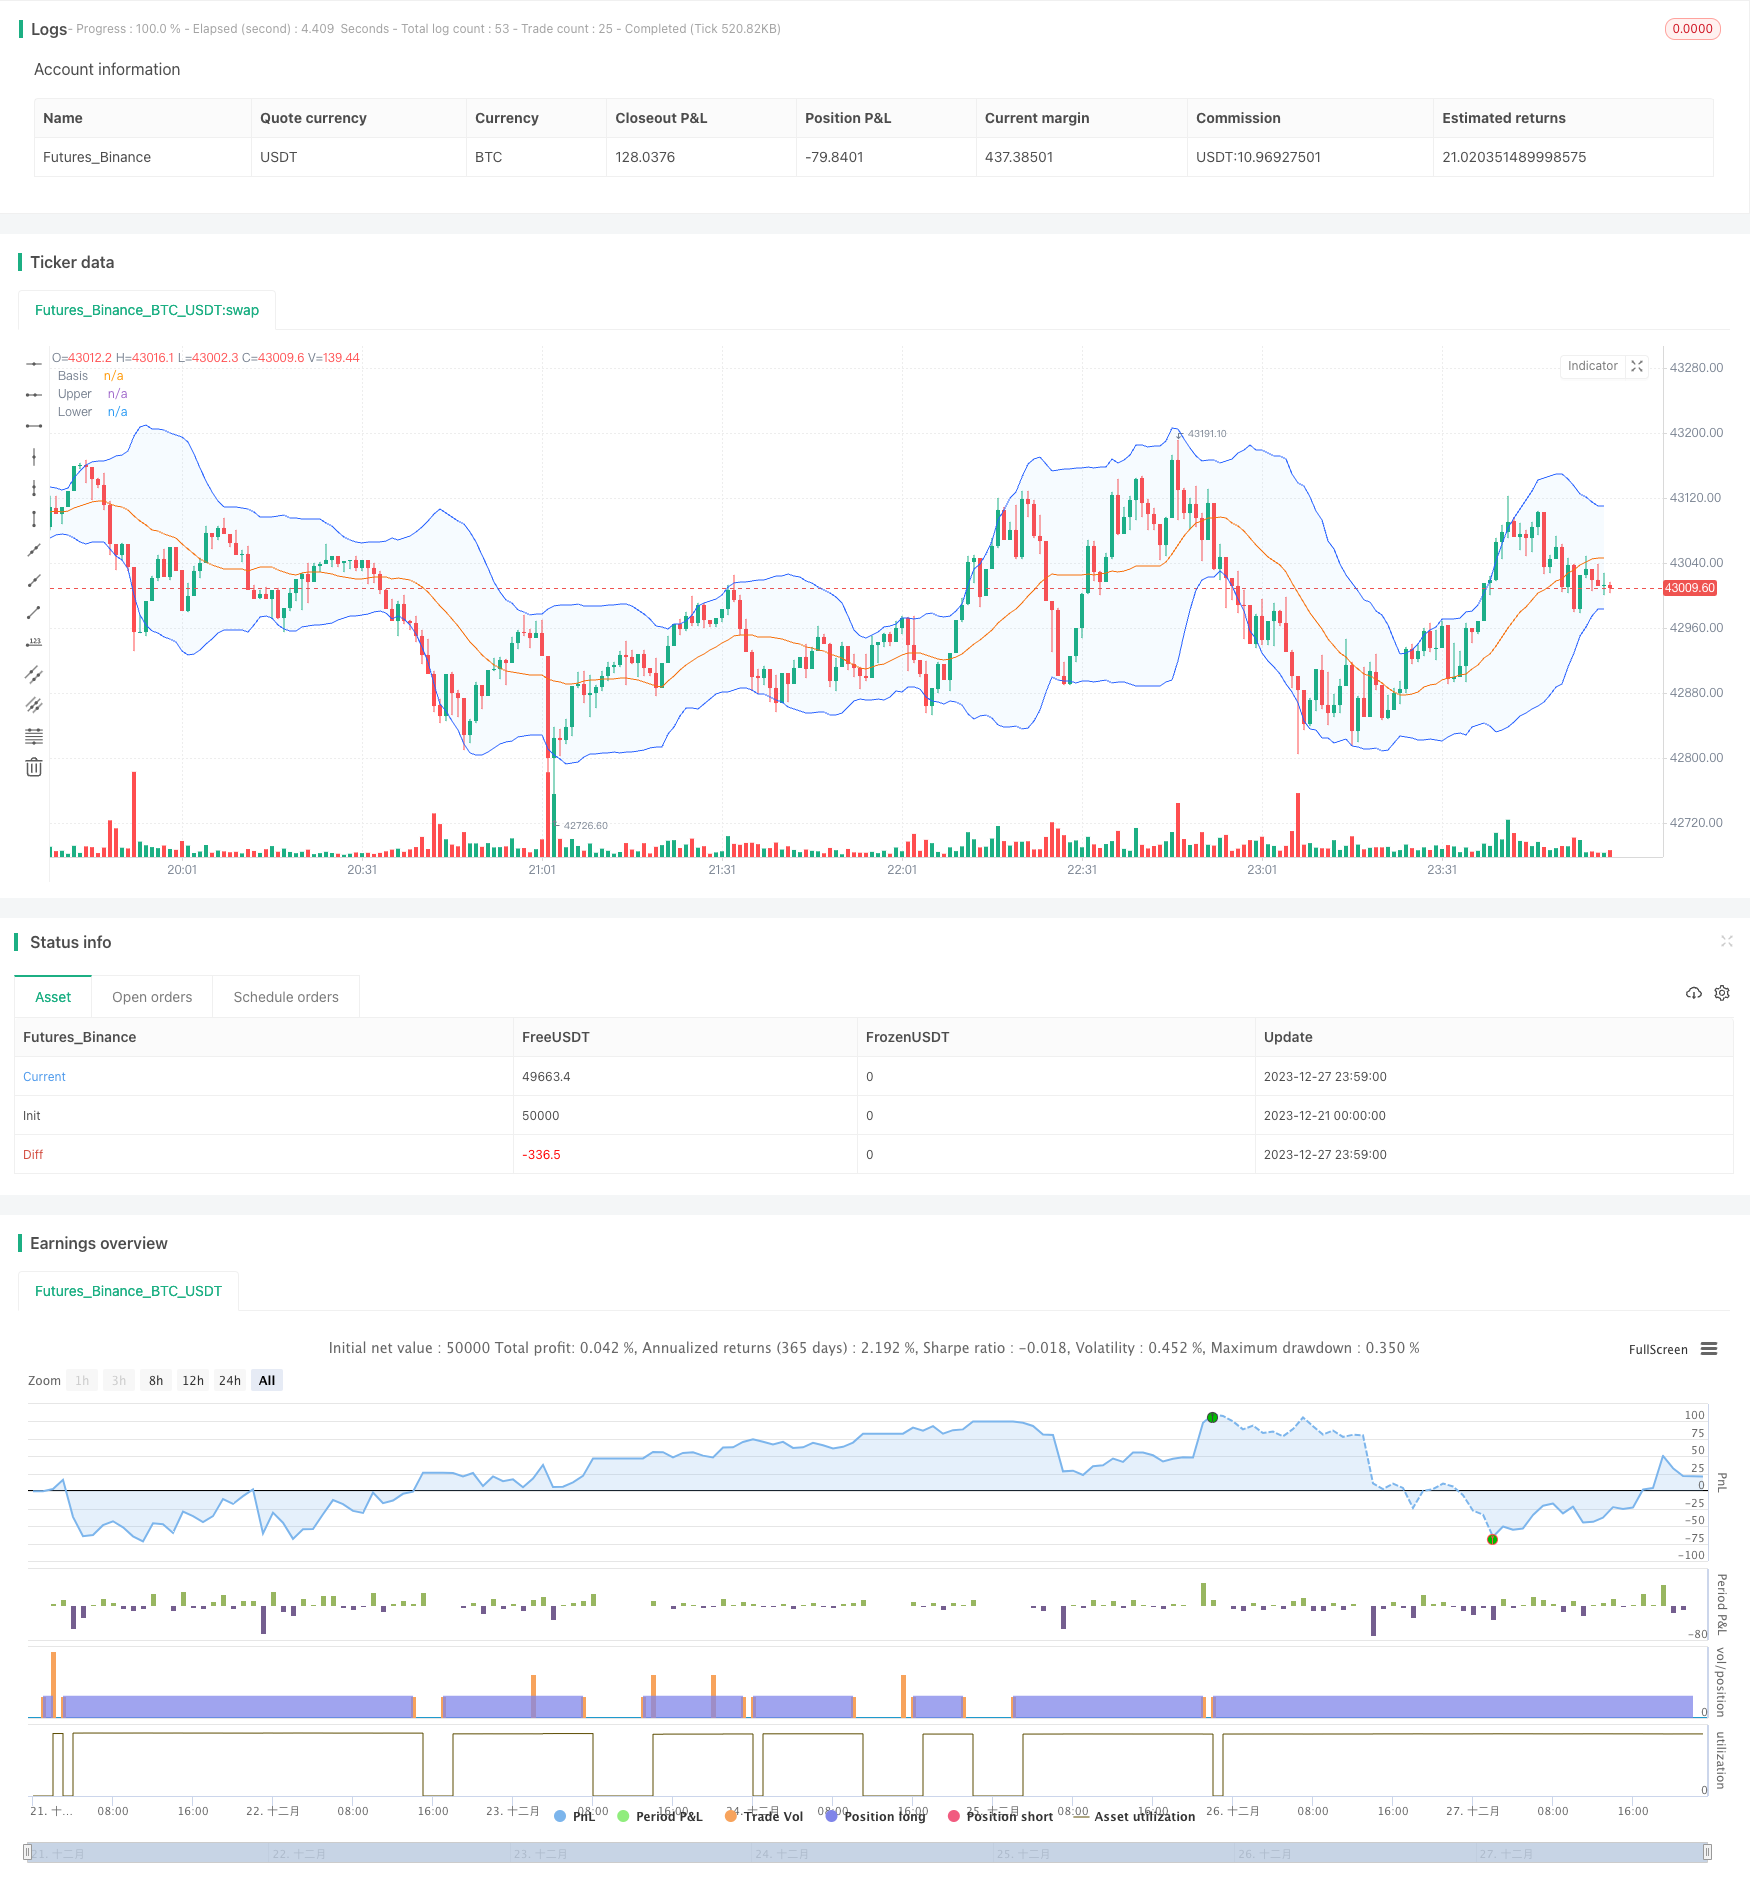
start: 2023-12-21 00:00:00
end: 2023-12-28 00:00:00
period: 1m
basePeriod: 1m
exchanges: [{"eid":"Futures_Binance","currency":"BTC_USDT"}]
*/
// This source code is subject to the terms of the Mozilla Public License 2.0 at https://mozilla.org/MPL/2.0/
// © KAIST291
//@version=4
strategy("prototype",initial_capital=0.01,commission_type=strategy.commission.percent,commission_value=0.1, format=format.volume, precision=0,overlay=true)
// SETTING //
length1=input(1)
length3=input(3)
length7=input(7)
length14=input(14)
length20=input(20)
length60=input(60)
length120=input(120)
ma1= sma(close,length1)
ma3= sma(close,length3)
ma7= sma(close,length7)
ma14=sma(close,length14)
ma20=sma(close,length20)
ma60=sma(close,length60)
ma120=sma(close,length120)
rsi=rsi(close,14)
// BUYING VOLUME AND SELLING VOLUME //
BV = iff( (high==low), 0, volume*(close-low)/(high-low))
SV = iff( (high==low), 0, volume*(high-close)/(high-low))
vol = iff(volume > 0, volume, 1)
dailyLength = input(title = "Daily MA length", type = input.integer, defval = 50, minval = 1, maxval = 100)
weeklyLength = input(title = "Weekly MA length", type = input.integer, defval = 10, minval = 1, maxval = 100)
//-----------------------------------------------------------
Davgvol = sma(volume, dailyLength)
Wavgvol = sma(volume, weeklyLength)
//-----------------------------------------------------------
length = input(20, minval=1)
src = input(close, title="Source")
mult = input(2.0, minval=0.001, maxval=50, title="StdDev")
mult2= input(1.5, minval=0.001, maxval=50, title="exp")
mult3= input(1.0, minval=0.001, maxval=50, title="exp1")
basis = sma(src, length)
dev = mult * stdev(src, length)
upper = basis + dev
lower = basis - dev
dev2= mult2 * stdev(src, length)
Supper= basis + dev2
Slower= basis - dev2
dev3= mult3 * stdev(src, length)
upper1= basis + dev3
lower1= basis - dev3
offset = input(0, "Offset", type = input.integer, minval = -500, maxval = 500)
plot(basis, "Basis", color=#FF6D00, offset = offset)
p1 = plot(upper, "Upper", color=#2962FF, offset = offset)
p2 = plot(lower, "Lower", color=#2962FF, offset = offset)
fill(p1, p2, title = "Background", color=color.rgb(33, 150, 243, 95))
//----------------------------------------------------
exit=(close-strategy.position_avg_price / strategy.position_avg_price*100)
bull=(close>Supper and BV>SV and BV>Davgvol)
bull2=(close>ma20 and BV>SV and BV>Davgvol)
bux =(close<Supper and close>Slower and volume<Wavgvol)
bear=(close<Slower and close<lower and SV>BV and SV>Wavgvol)
hi=highest(exit,10)
imInATrade = strategy.position_size != 0
highestPriceAfterEntry = valuewhen(imInATrade, high, 0)
// STRATEGY LONG //
if (bull and close>ma3 and ma20>ma60 and rsi<70)
strategy.entry("Long",strategy.long,0.1)
if (strategy.position_avg_price*1.05<close)
strategy.close("Long",0.1)
else if (highestPriceAfterEntry*0.999<close and close>strategy.position_avg_price*1.002)
strategy.close("Long",0.1)
else if (highestPriceAfterEntry*0.997<close and close>strategy.position_avg_price*1.002)
strategy.close("Long",0.1)
else if (highestPriceAfterEntry*0.995<close and close>strategy.position_avg_price*1.002)
strategy.close("Long",0.1)
else if (strategy.openprofit < strategy.position_avg_price*0.9-close)
strategy.close("Long",0.1)
//////////////////////////////////////////////////////////////////////////////////
//////////////////////////////////////////////////////////////////////////////////