概述
本策略引入了一种基于斐波那契数列的Hull移动平均线(HMA)的交易策略,以识别潜在的买入和卖出信号。该策略运用特定的与斐波那契数列相关的HMA线,旨在为交易环境中可能的入市和退市点提供洞察。
策略原理
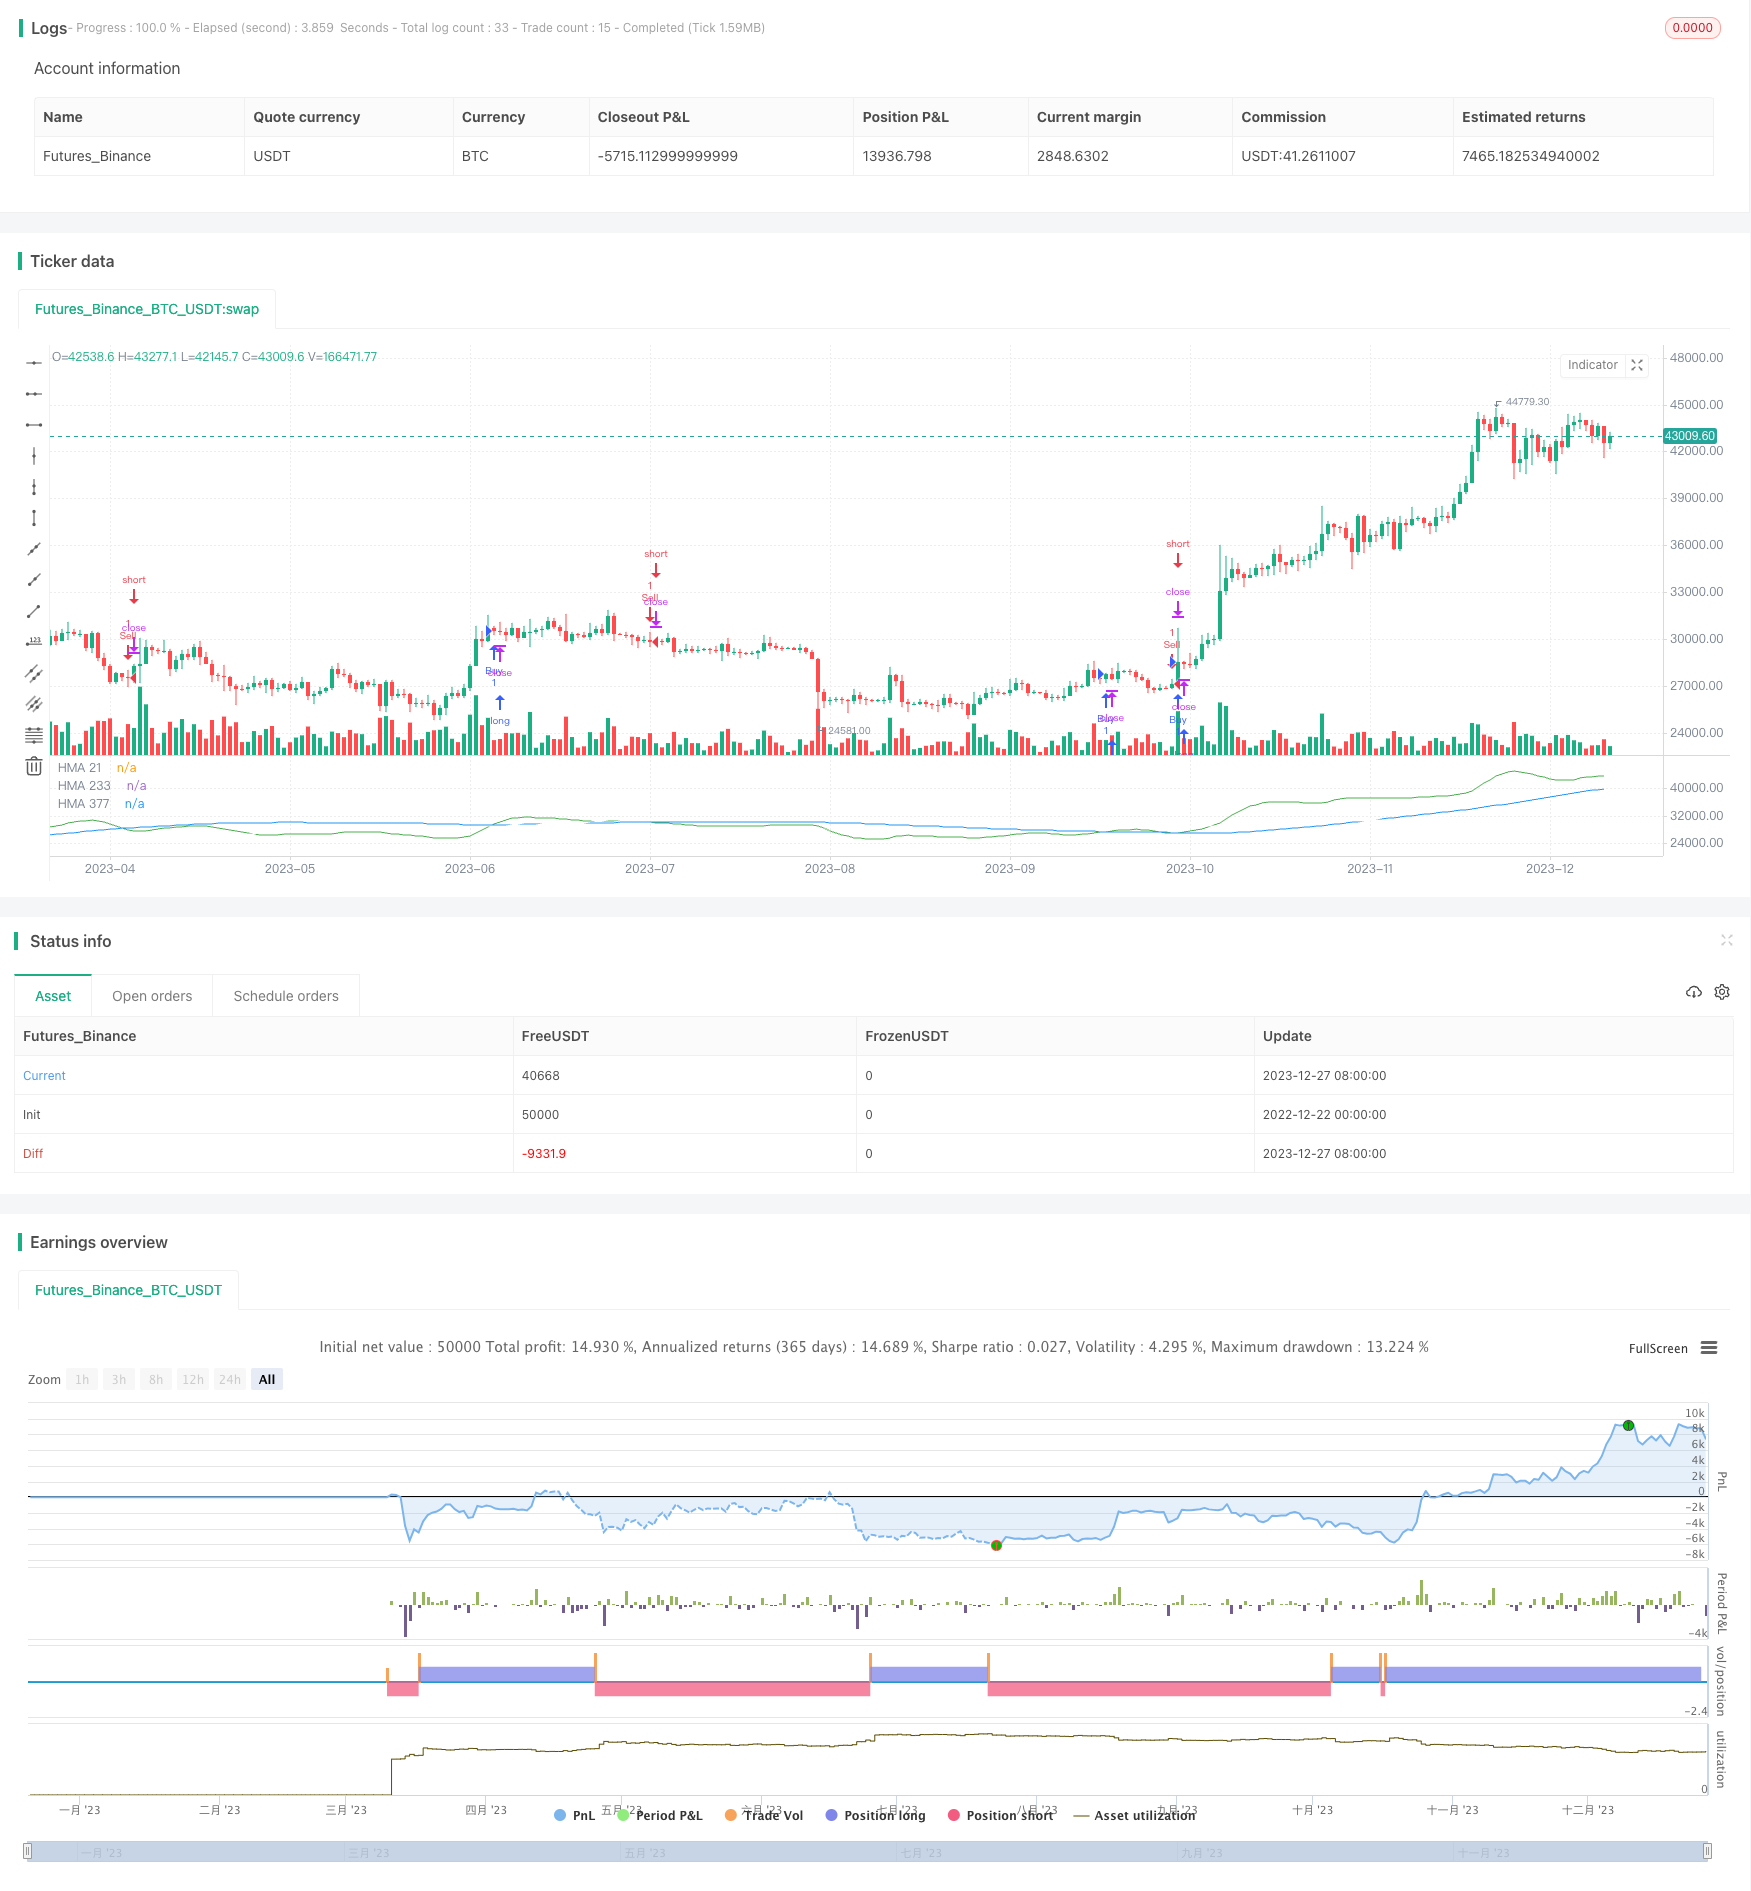
该策略使用与斐波那契数列中数字1、2和3相关的独特HMA线,即HMA 1、HMA 2和HMA 3。当这些HMA线发生交叉时,会生成自动的买入和卖出信号。例如,当HMA 3上穿HMA 2时会产生买入信号,而当HMA 3下穿HMA 2时会产生卖出信号。这些HMA线使用不同的颜色进行可视化表示,以方便识别交易机会。
优势分析
该策略结合了斐波那契分析和Hull移动平均线的优点。斐波那契分析可用于识别关键的支撑与阻力位,而HMA线平滑价格数据减少噪音,生成更可靠的交易信号。此外,该策略简化了视觉呈现,易于判断趋势的开始和结束。
风险分析
该策略可能会在价格震荡时产生错误信号。此外,参数设置不当也会影响策略表现。需要调整HMA线的周期长度以适应不同的市场环境。
优化方向
可以考虑结合其他指标进行信号过滤,例如RSI来避免错误信号。此外,可以测试不同参数组合的实际交易表现,以确定最佳参数。也可以尝试把该策略与其他交易策略组合使用。
总结
本策略充分利用了斐波那契数列在金融市场中的应用优势,与HMA指标的信号过滤能力相结合,形成一个用于发现潜在趋势的有效工具。该策略简单直观,容易实施,值得进一步测试与优化。
策略源码
/*backtest
start: 2022-12-22 00:00:00
end: 2023-12-28 00:00:00
period: 1d
basePeriod: 1h
exchanges: [{"eid":"Futures_Binance","currency":"BTC_USDT"}]
*/

//@version=4
// © Blackynator
strategy("AI Fibonacci HMA Strategy | Buy / Sell Indicator")

// Set the parameters for the moving averages
hma377Period = 377
hma233Period = 233
hma21Period = 21

// Calculate the moving averages
hma377 = hma(close, hma377Period)
hma233 = hma(close, hma233Period)
hma21 = hma(close, hma21Period)

// Plot the moving averages on the chart with different colors and titles
plot(hma377, color=color.white, title="HMA 377")
plot(hma233, color=color.blue, title="HMA 233")
plot(hma21, color=color.green, title="HMA 21")

// Create variables to hold the HMA 21 value and its previous value
hmaValue = hma21
hmaValuePrev = nz(hmaValue[1], hmaValue)

// Create variables to hold the HMA 200 value and its previous value
hma233Value = hma233
hma233ValuePrev = nz(hma233Value[1], hma233Value)

// Check if the HMA 21 has crossed up the HMA 200 and create a buy signal if it has
if (hmaValue > hma233Value) and (hmaValuePrev < hma233ValuePrev)
    strategy.entry("Buy", true)

// Check if the HMA 21 has crossed down the HMA 200 and create a sell signal if it has
if (hmaValue < hma233Value) and (hmaValuePrev > hma233ValuePrev)
    strategy.entry("Sell", false)