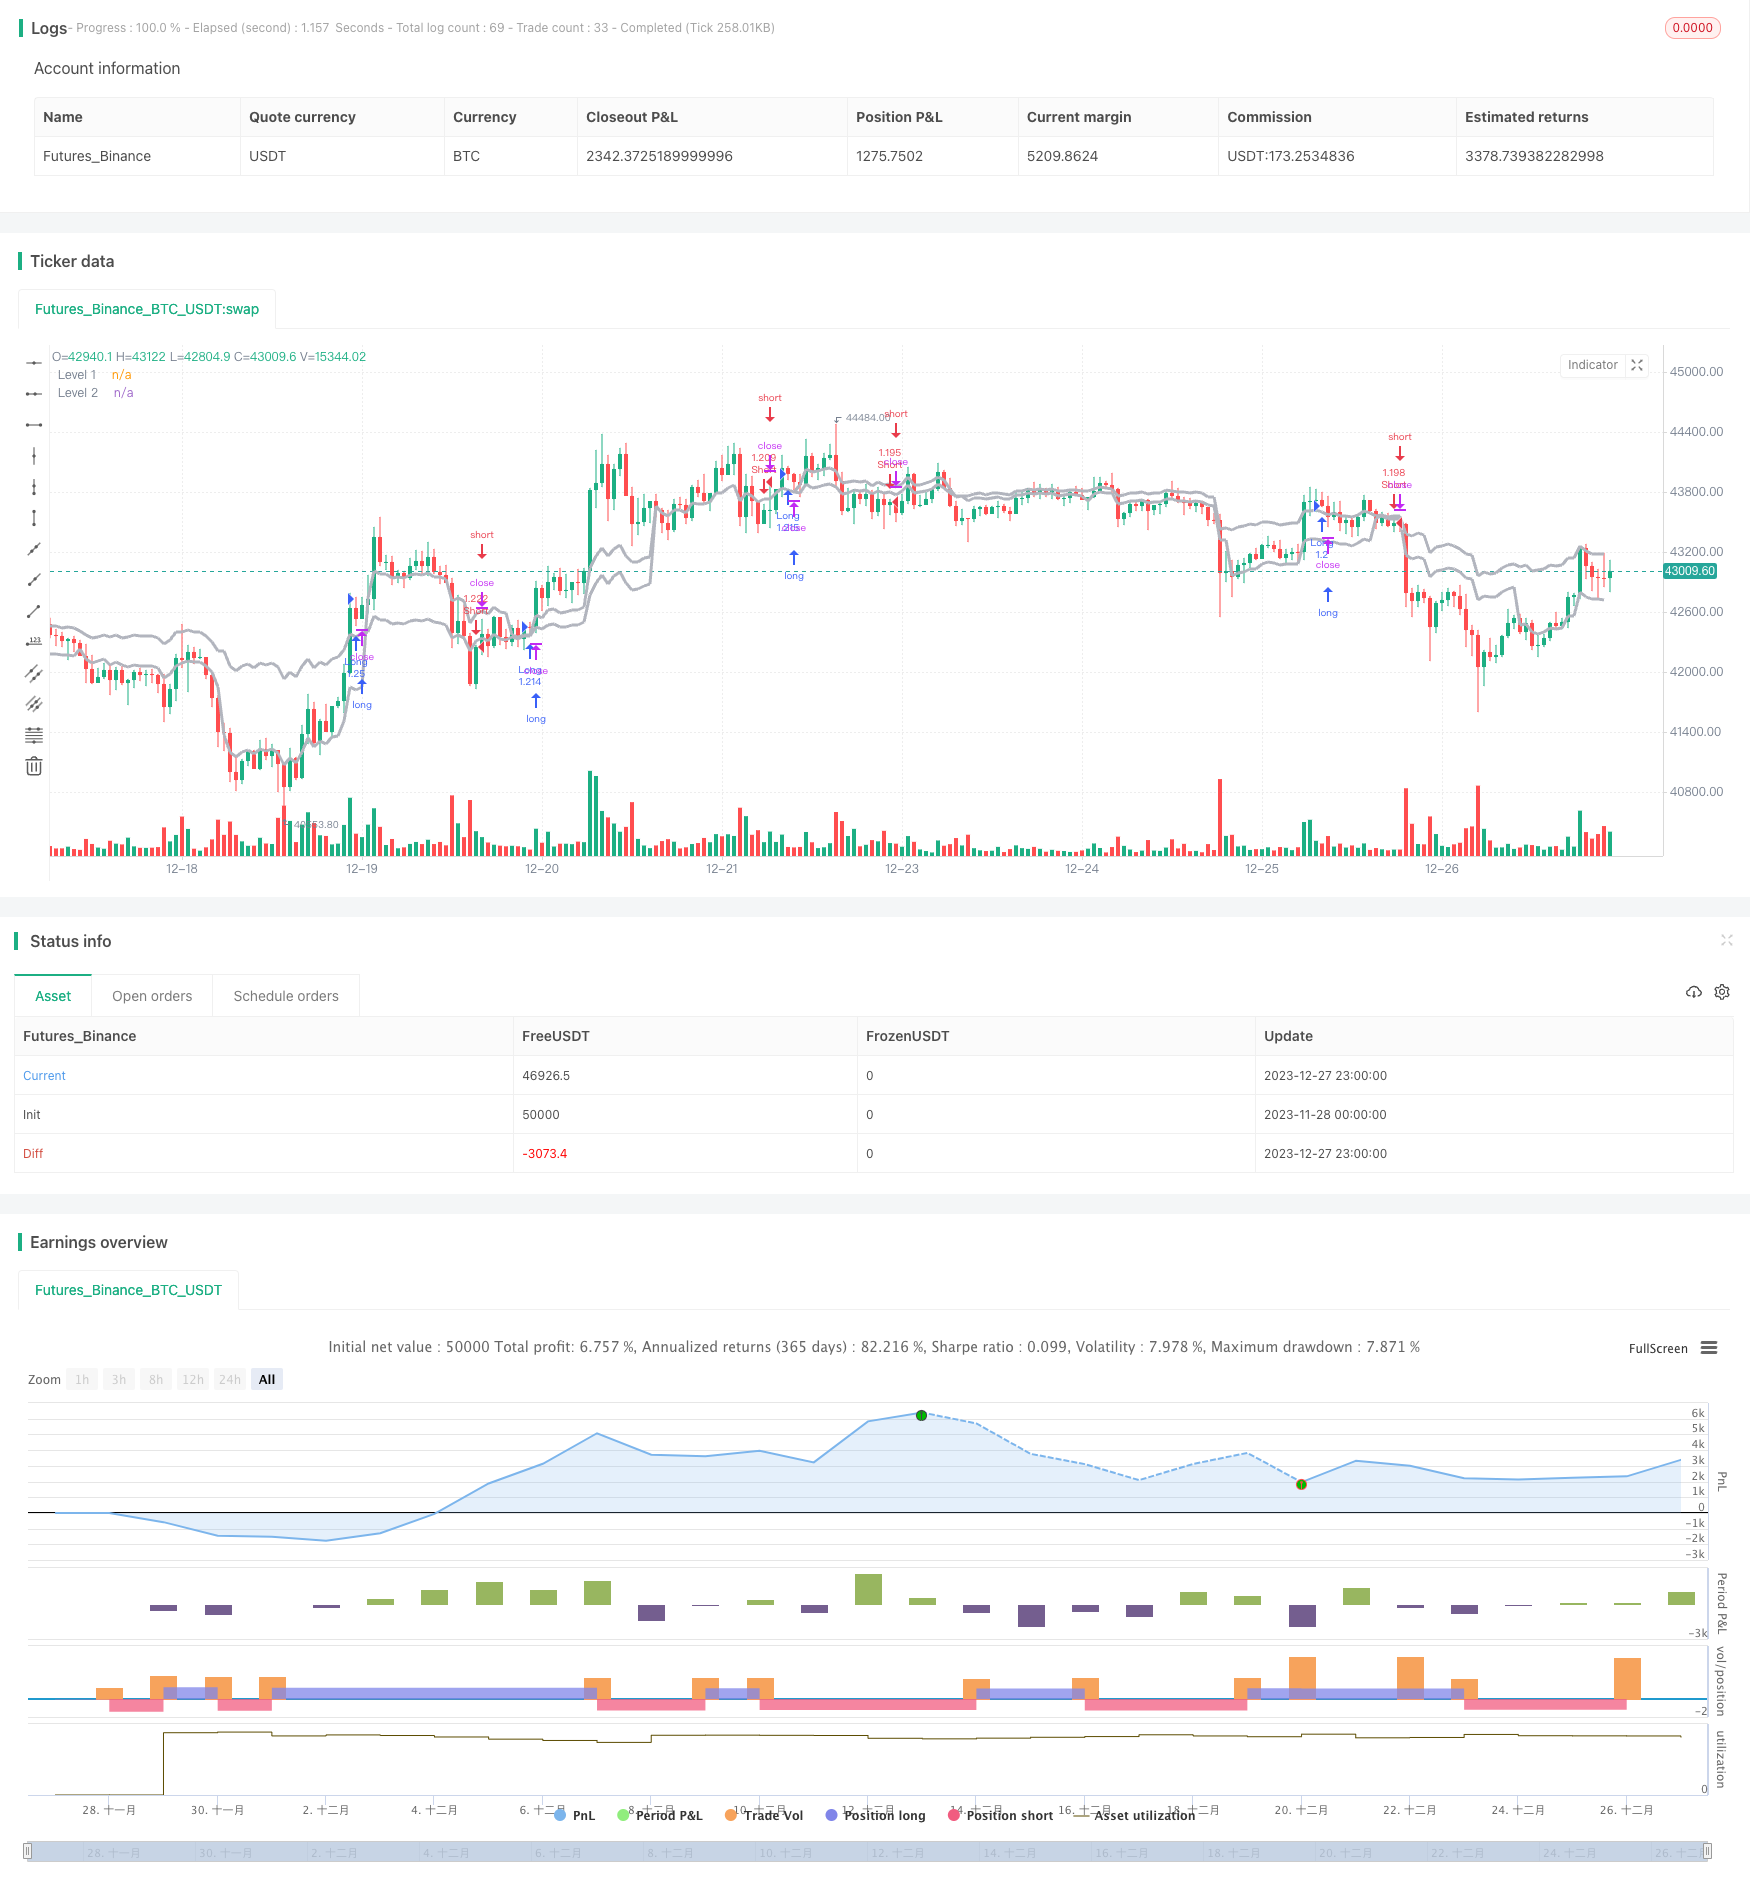
概述
多时间框架突破策略通过组合使用两个不同时间框架上的价格突破信号,实现更可靠的交易信号产生。该策略同时在1小时、2小时、3小时等短时间框架和4小时、日线等较长时间框架上计算价格突破信号,当两个时间框架上的信号同向时,才会生成买入或卖出信号,进行对应方向的交易。
策略原理
该策略的核心逻辑是在两个不同的时间框架上分别计算价格突破信号,然后进行匹配过滤。具体来说,策略会在一个较短的时间框架(比如1小时线)上计算价格是否突破指定水平,同时在一个较长的时间框架(比如4小时线)上也相应计算价格是否突破指定水平。只有当两个时间框架上的突破信号方向一致时,即在两个时间框架上价格均突破上行或下行指定水平时,策略才会产生交易信号。
产生买入信号的条件是,短时间框架和长时间框架上的收盘价或最低价都突破相应的价格水平。产生卖出信号的条件是,短时间框架和长时间框架上的收盘价或最高价都突破相应的价格水平。策略通过这样的多时间框架匹配方式,可以过滤掉部分假信号,使信号更加可靠。
优势分析
该策略最大的优势在于其交易信号可靠性较高。通过在两个时间框架上都要求价格突破对应的水平,可以有效滤除部分噪音,避免错交易。另外,不同时间框架上的突破信号可以互相验证,使交易机会更有效。此外,策略提供了一定的灵活性,允许选择两个组合使用的时间框架,以及数据源等,用户可以根据自己的需要进行调整。
风险分析
该策略的主要风险在于,在市场平静的 Zeit 段,容易出现两个时间框架上的价格都不会有突破的情况。这时,策略将不会产生任何交易信号,可能错过交易机会。此外,两个时间框架之间也存在一定的时滞,可能导致信号的效率不高。另外,策略并没有设置止损逻辑,存在较大的风险。
优化方向
该策略可以从以下几个方面进行优化:1)增加止损逻辑,以控制风险;2)优化时间框架的组合,提高交易效率;3)增加更多时间框架进行组合,使交易信号更加严格;4)结合其他指标进行过滤,提高信号质量;5)开发Exiting机制,更好的控制利润等。
总结
多时间框架突破策略通过比较两个时间框架上的价格突破情况,提高信号质量,是一种较为可靠的趋势跟踪策略。但也存在一定的缺陷,可通过不断优化,使其成为一个稳定可靠的量化交易策略。
/*backtest
start: 2023-11-28 00:00:00
end: 2023-12-28 00:00:00
period: 1h
basePeriod: 15m
exchanges: [{"eid":"Futures_Binance","currency":"BTC_USDT"}]
*/

//Noro
//2018

//@version=3
strategy(title = "Noro's Levels Strategy v1.1", shorttitle = "Levels str 1.1", overlay = true, default_qty_type = strategy.percent_of_equity, default_qty_value = 100, pyramiding = 0)

//Settings
needlong = input(true, defval = true, title = "Long")
needshort = input(true, defval = true, title = "Short")
capital = input(100, defval = 100, minval = 1, maxval = 10000, title = "Capital, %")
tf1 = input('W', title = "timeframe 1")
tf2 = input('D', title = "timeframe 2")
src = input(ohlc4, "Source")
ap = input(true, defval = true, title = "use saw filter")
cf = input(true, defval = true, title = "гыу color filter")
showlines = input(true, defval = true, title = "Show lines")
fromyear = input(1900, defval = 1900, minval = 1900, maxval = 2100, title = "From Year")
toyear = input(2100, defval = 2100, minval = 1900, maxval = 2100, title = "To Year")
frommonth = input(01, defval = 01, minval = 01, maxval = 12, title = "From Month")
tomonth = input(12, defval = 12, minval = 01, maxval = 12, title = "To Month")
fromday = input(01, defval = 01, minval = 01, maxval = 31, title = "From day")
today = input(31, defval = 31, minval = 01, maxval = 31, title = "To day")

//Levels
level1 = request.security(syminfo.tickerid, tf1, src)
level2 = request.security(syminfo.tickerid, tf2, src)
col = showlines ? silver : na
p1 = plot(level1, linewidth = 3, color = col, title = "Level 1")
p2 = plot(level2, linewidth = 3, color = col, title = "Level 2")

//Signals
up1 = close > level1 and ap == false ? true : low > level1 ? true : false
dn1 = close < level1 and ap == false ? true : high < level1 ? true : false
up2 = close > level2 and ap == false ? true : low > level2 ? true : false
dn2 = close < level2 and ap == false ? true : high < level2 ? true : false

//Trading
size = strategy.position_size
lot = 0.0
lot := size != size[1] ? strategy.equity / close * capital / 100 : lot[1]

if up1 and up2 and (close < open or cf == false)
    strategy.entry("Long", strategy.long, needlong == false ? 0 : lot, when = (time > timestamp(fromyear, frommonth, fromday, 00, 00) and time < timestamp(toyear, tomonth, today, 23, 59)))

if dn1 and dn2 and (close > open or cf == false)
    strategy.entry("Short", strategy.short, needshort == false ? 0 : lot, when = (time > timestamp(fromyear, frommonth, fromday, 00, 00) and time < timestamp(toyear, tomonth, today, 23, 59)))

if time > timestamp(toyear, tomonth, today, 23, 59)
    strategy.close_all()