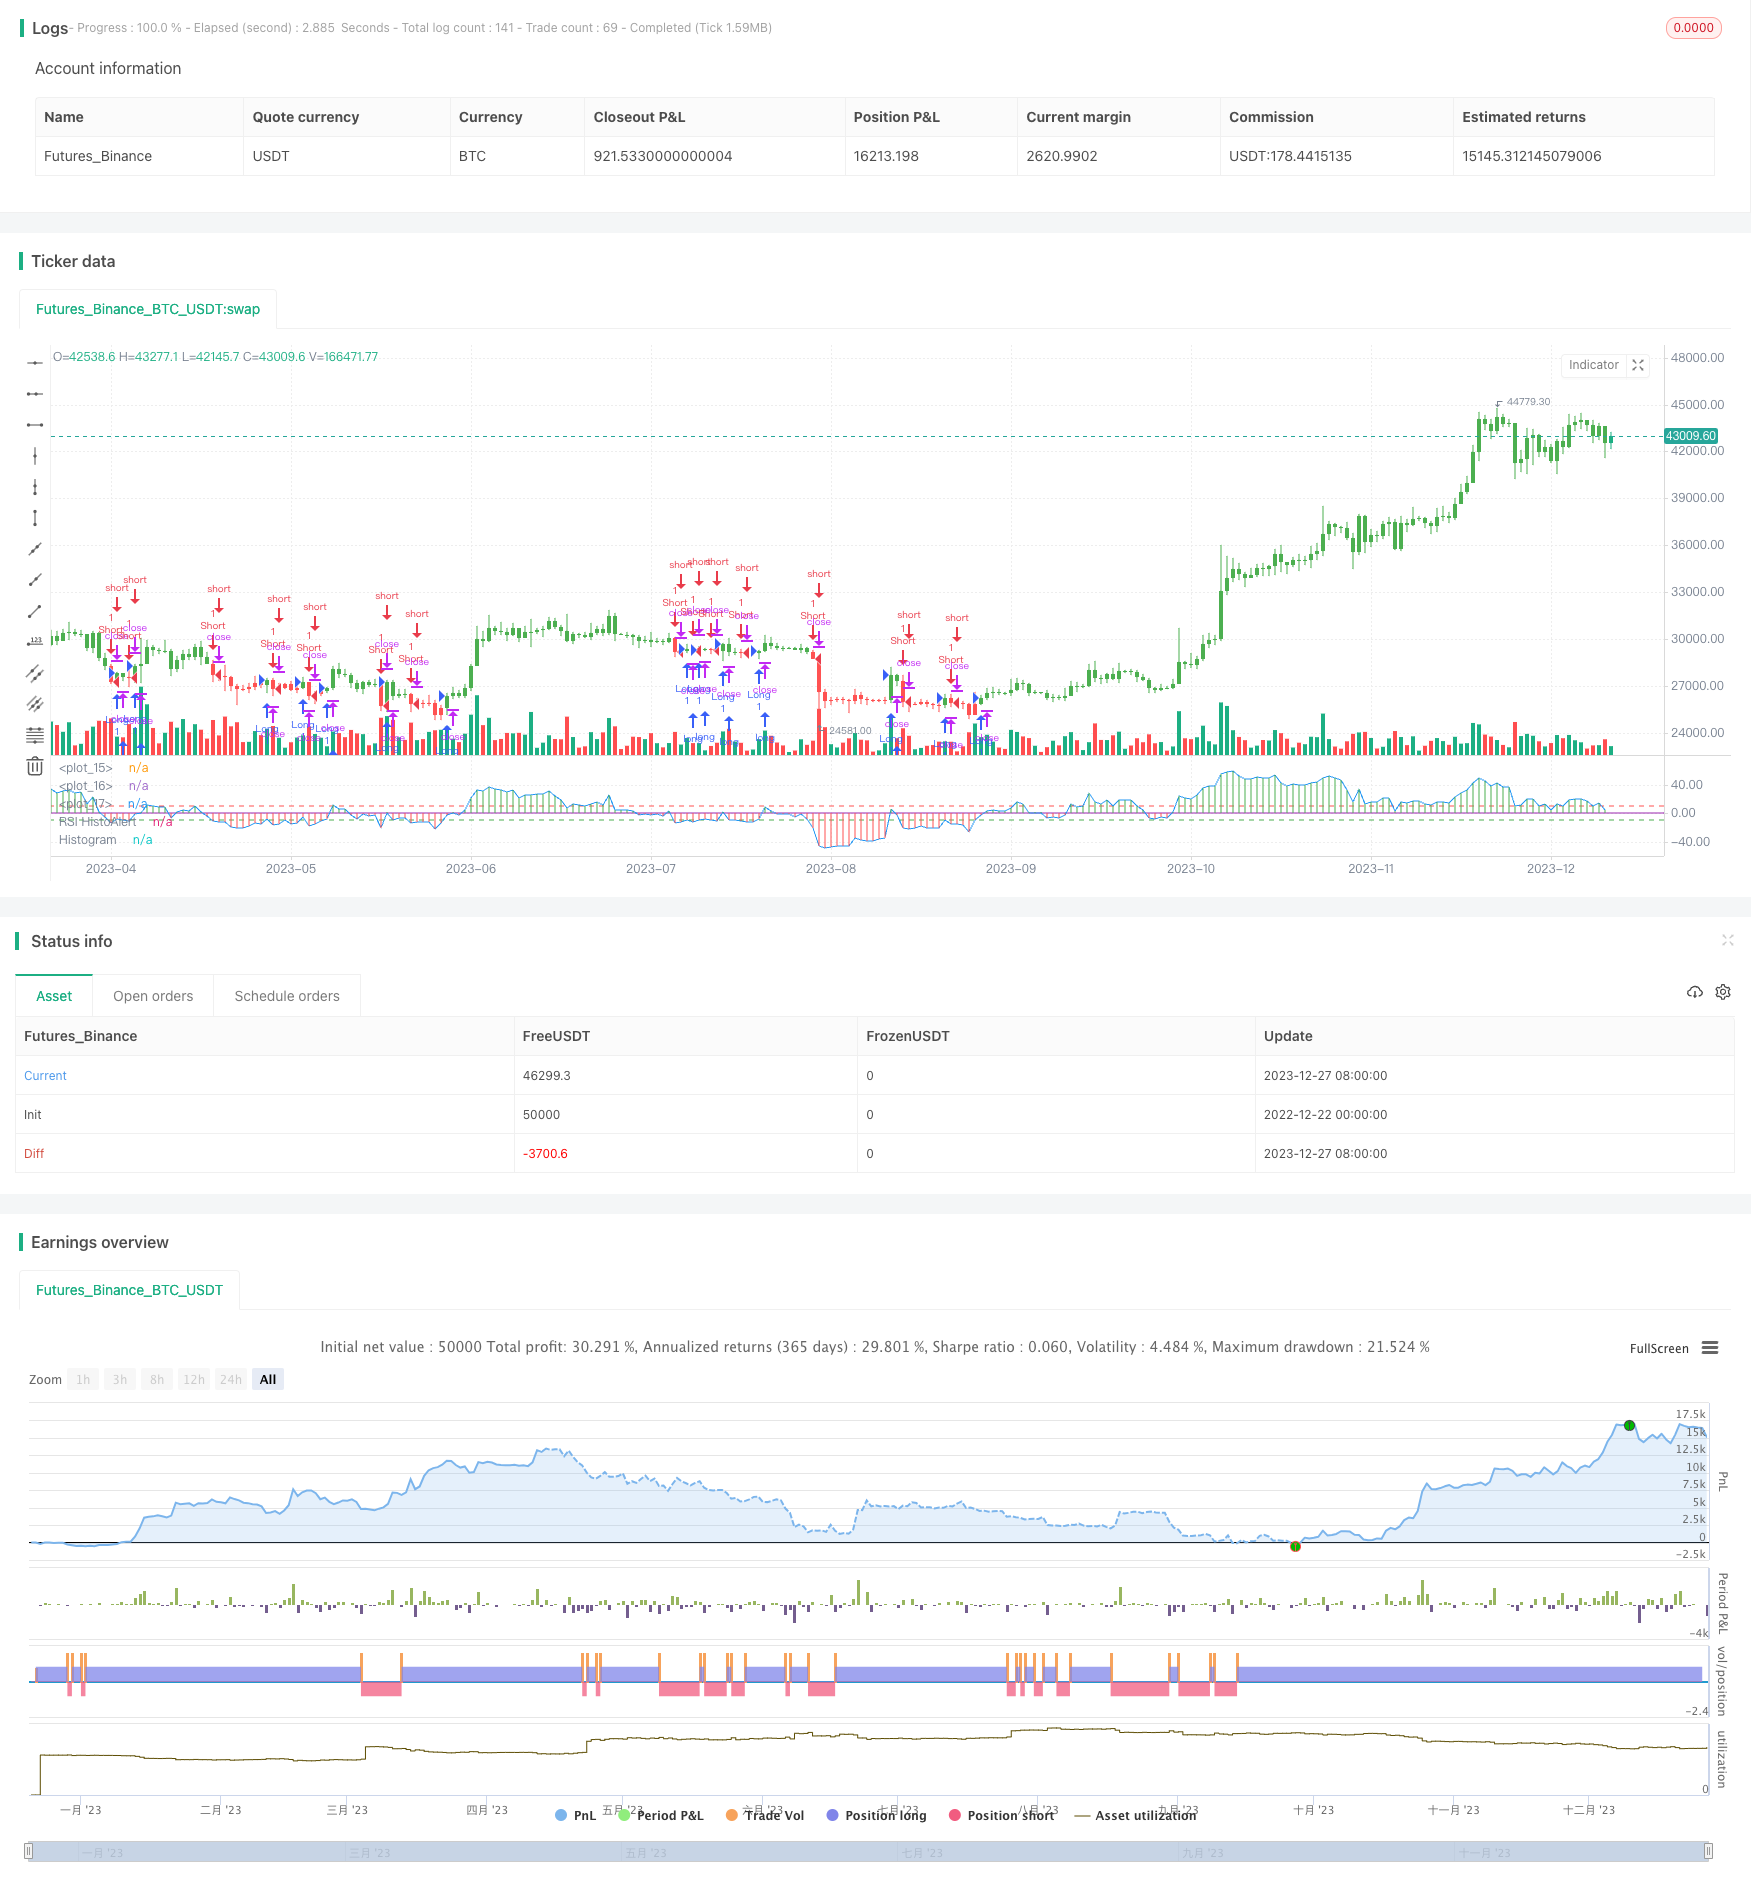
一、策略概述
本策略对经典的RSI指标进行了改进,设置买入和卖出的警戒线,当RSI指标突破警戒线时,进行相应的买入或者卖出操作。同时,该策略还提供长短仓切换功能。
二、策略详情
1. 策略名称:RSI Histogram Alert Strategy
该策略通过RSI指标的Histogram实现买卖信号的触发。
2. 策略原理
(1)计算RSI指标的值,公式为:
RSIMain = (rsi(xPrice, RSIPeriod) - 50) * RSIHistoModify
其中,xPrice为价格序列,RSIPeriod为计算RSI的参数,RSIHistoModify为RSI的值的一个缩放系数。
(2)设置买入警戒线BuyAlertLevel和卖出警戒线SellAlertLevel。当RSI指标高于买入警戒线时为买入信号,低于卖出警戒线时为卖出信号。
(3)绘制RSI指标的Histogram,可视化买卖信号。
(4)设置仓位pos,当触发信号时,将pos设置为1(做多)或-1(做空)。并可以选择正向交易或反向交易。
(5)根据pos的值判断入场方向和价格。
3. 策略优势
(1)改进了RSI指标的使用方式,更清晰的展示买卖信号。
(2)可自定义参数,对RSI指标和警戒线进行调整,适应不同市场。
(3)直观的展示买卖信号的 Histogram。
(4)可选择正向交易或反向交易。
(5)策略思路简单清晰,容易理解和修改。
4. 策略风险
(1)容易产生错误信号,RSI指标本身就容易形成错误信号。
(2)未考虑止损,可能存在较大亏损的风险。
(3)参数设置不当也会导致失败。
5. 策略优化方向
(1)结合其他指标过滤信号,避免错误信号。例如考虑成交量的突破。
(2)设置止损机制。
(3)参数优化,找到最优参数。
(4)可以考虑与机器学习相结合,利用算法自动寻找最优参数。
三、总结
本策略通过改进RSI指标的使用方式,设置买卖警戒线,更清楚直观的表达买卖信号。相比原始RSI指标有更强的实用性。但也存在一定的风险,需要进一步优化改进,结合其他技术指标和止损来降低风险。该策略思路简单,适合量化交易的初学者学习和实践。
/*backtest
start: 2022-12-22 00:00:00
end: 2023-12-28 00:00:00
period: 1d
basePeriod: 1h
exchanges: [{"eid":"Futures_Binance","currency":"BTC_USDT"}]
*/

//@version=2
////////////////////////////////////////////////////////////
//  Copyright by HPotter v1.0 22/12/2016
// This simple indicator modified RSI
// You can use in the xPrice any series: Open, High, Low, Close, HL2, HLC3, OHLC4 and ect...
// You can change long to short in the Input Settings
// Please, use it only for learning or paper trading. Do not for real trading.
////////////////////////////////////////////////////////////
strategy(title="RSI HistoAlert Strategy")
RSIPeriod = input(13, minval=1)
BuyAlertLevel = input(-10)
SellAlertLevel = input(10)
RSIHistoModify = input(1.5)
reverse = input(false, title="Trade reverse")
hline(0, color=purple, linestyle=line)
hline(BuyAlertLevel, color=green)
hline(SellAlertLevel, color=red)
xPrice = close
RSIMain = (rsi(xPrice, RSIPeriod) - 50) * RSIHistoModify
rsiHcolor =  iff(RSIMain >= 0 , green,
              iff(RSIMain < 0, red, black))
pos = iff(RSIMain > BuyAlertLevel, 1,
	     iff(RSIMain < SellAlertLevel, -1, nz(pos[1], 0)))
possig = iff(reverse and pos == 1, -1,
          iff(reverse and pos == -1, 1, pos))
if (possig == 1)
    strategy.entry("Long", strategy.long)
if (possig == -1)
    strategy.entry("Short", strategy.short)
barcolor(possig == -1 ? red: possig == 1 ? green : blue )
plot(RSIMain, color=blue, title="RSI HistoAlert")
plot(RSIMain, color=rsiHcolor, title="Histogram", style = histogram, linewidth  = 1)