概述
多重RSI指标聚合策略是一个利用多重相对强度指数(RSI)指标进行股票择时交易的策略。该策略同时使用1、2、3、4、5个不同周期的RSI指标,当任一RSI指标低于设定的极限值时产生买入信号,当所有RSI指标都高于各自的极限值时产生卖出信号,实现股票的定时 entries 和 exits。
策略原理
该策略的核心逻辑是同时跟踪1、2、3、4、5个不同周期的RSI指标,包括4周期、7周期、14周期、21周期和28周期的RSI。这5个RSI指标分别设置了不同的极限值,只要任一RSI指标低于对应极限值,就会产生买入信号。
例如,4周期RSI指标的极限值设置为15,当4周期RSI低于15时就会产生买入信号。策略会同时检测其他周期的RSI指标是否也低于对应的极限值,如果是,也会产生买入信号。
当全部5个RSI指标都高于各自的极限值后,会产生卖出信号,实现盈利了结。这样通过聚合多个周期指标的信号,可以提高 Entries 的准确性。
策略优势
- 利用多重 RSI 指标提高 Entries 准确性
该策略同时使用 5 个不同周期的 RSI 指标,当任一 RSI 低于极限值时产生买入信号。这可以提高信号的可靠性,避免单一指标造成的错误信号。多重指标的聚合可以提高 Entries 的准确性。
- 不同周期指标适应多种市场情况
使用 1、2、3、4、5 周期的 RSI 指标,可以适应不同周期的股票波动。例如 28 周期 RSI 适合长线交易,4 周期 RSI 适合短线交易。这保证在多种市场情况下策略都可以正常工作。
- 代码结构清晰易懂
策略的变量命名和代码结构非常清晰,不同指标和信号的计算流程一目了然。这使得该策略很容易理解、修改和优化。这是量化策略非常重要的一个优点。
策略风险
- 单边市无效
该策略主要依赖超买超卖信号产生,在单边上涨或下跌的趋势行情中,其效果会打折扣。这是使用反转指标的策略普遍存在的问题。
- 参数优化难度大
策略包含多个指标和参数,这给参数优化带来很大难度。不合理的参数组合可能大幅降低策略效果。这需要利用优化工具找到最佳参数。
- 多空切换频繁
由于使用了多个周期指标,策略的多空切换可能会比较频繁,这会带来更高的交易成本和滑点风险。
策略优化方向
- 结合趋势指标
可以加入 MA 或 BOLL 等趋势指标,避免单边行情下打折。例如只在趋势指标也同意反转时才入场。
- 减少指标数量
尝试减少使用的 RSI 指标数量,降低参数优化难度。实验表明 2-3 个指标组合就可以获得不错效果。
- 优化参数范围
利用步长优化、随机优化等方法,寻找各 RSI 参数的最佳范围和组合,最大化提高策略表现。
总结
多重 RSI 指标聚合策略通过 congregation 多个周期 RSI 的 signals,提高 entries 准确性,实现股票的 timing trading。它有利用多种指标的优势,但也存在单边行情失效、优化难度大等问题。通过加入趋势指标、减少指标数量、优化参数等方法可以进一步提高策略 Robustness。
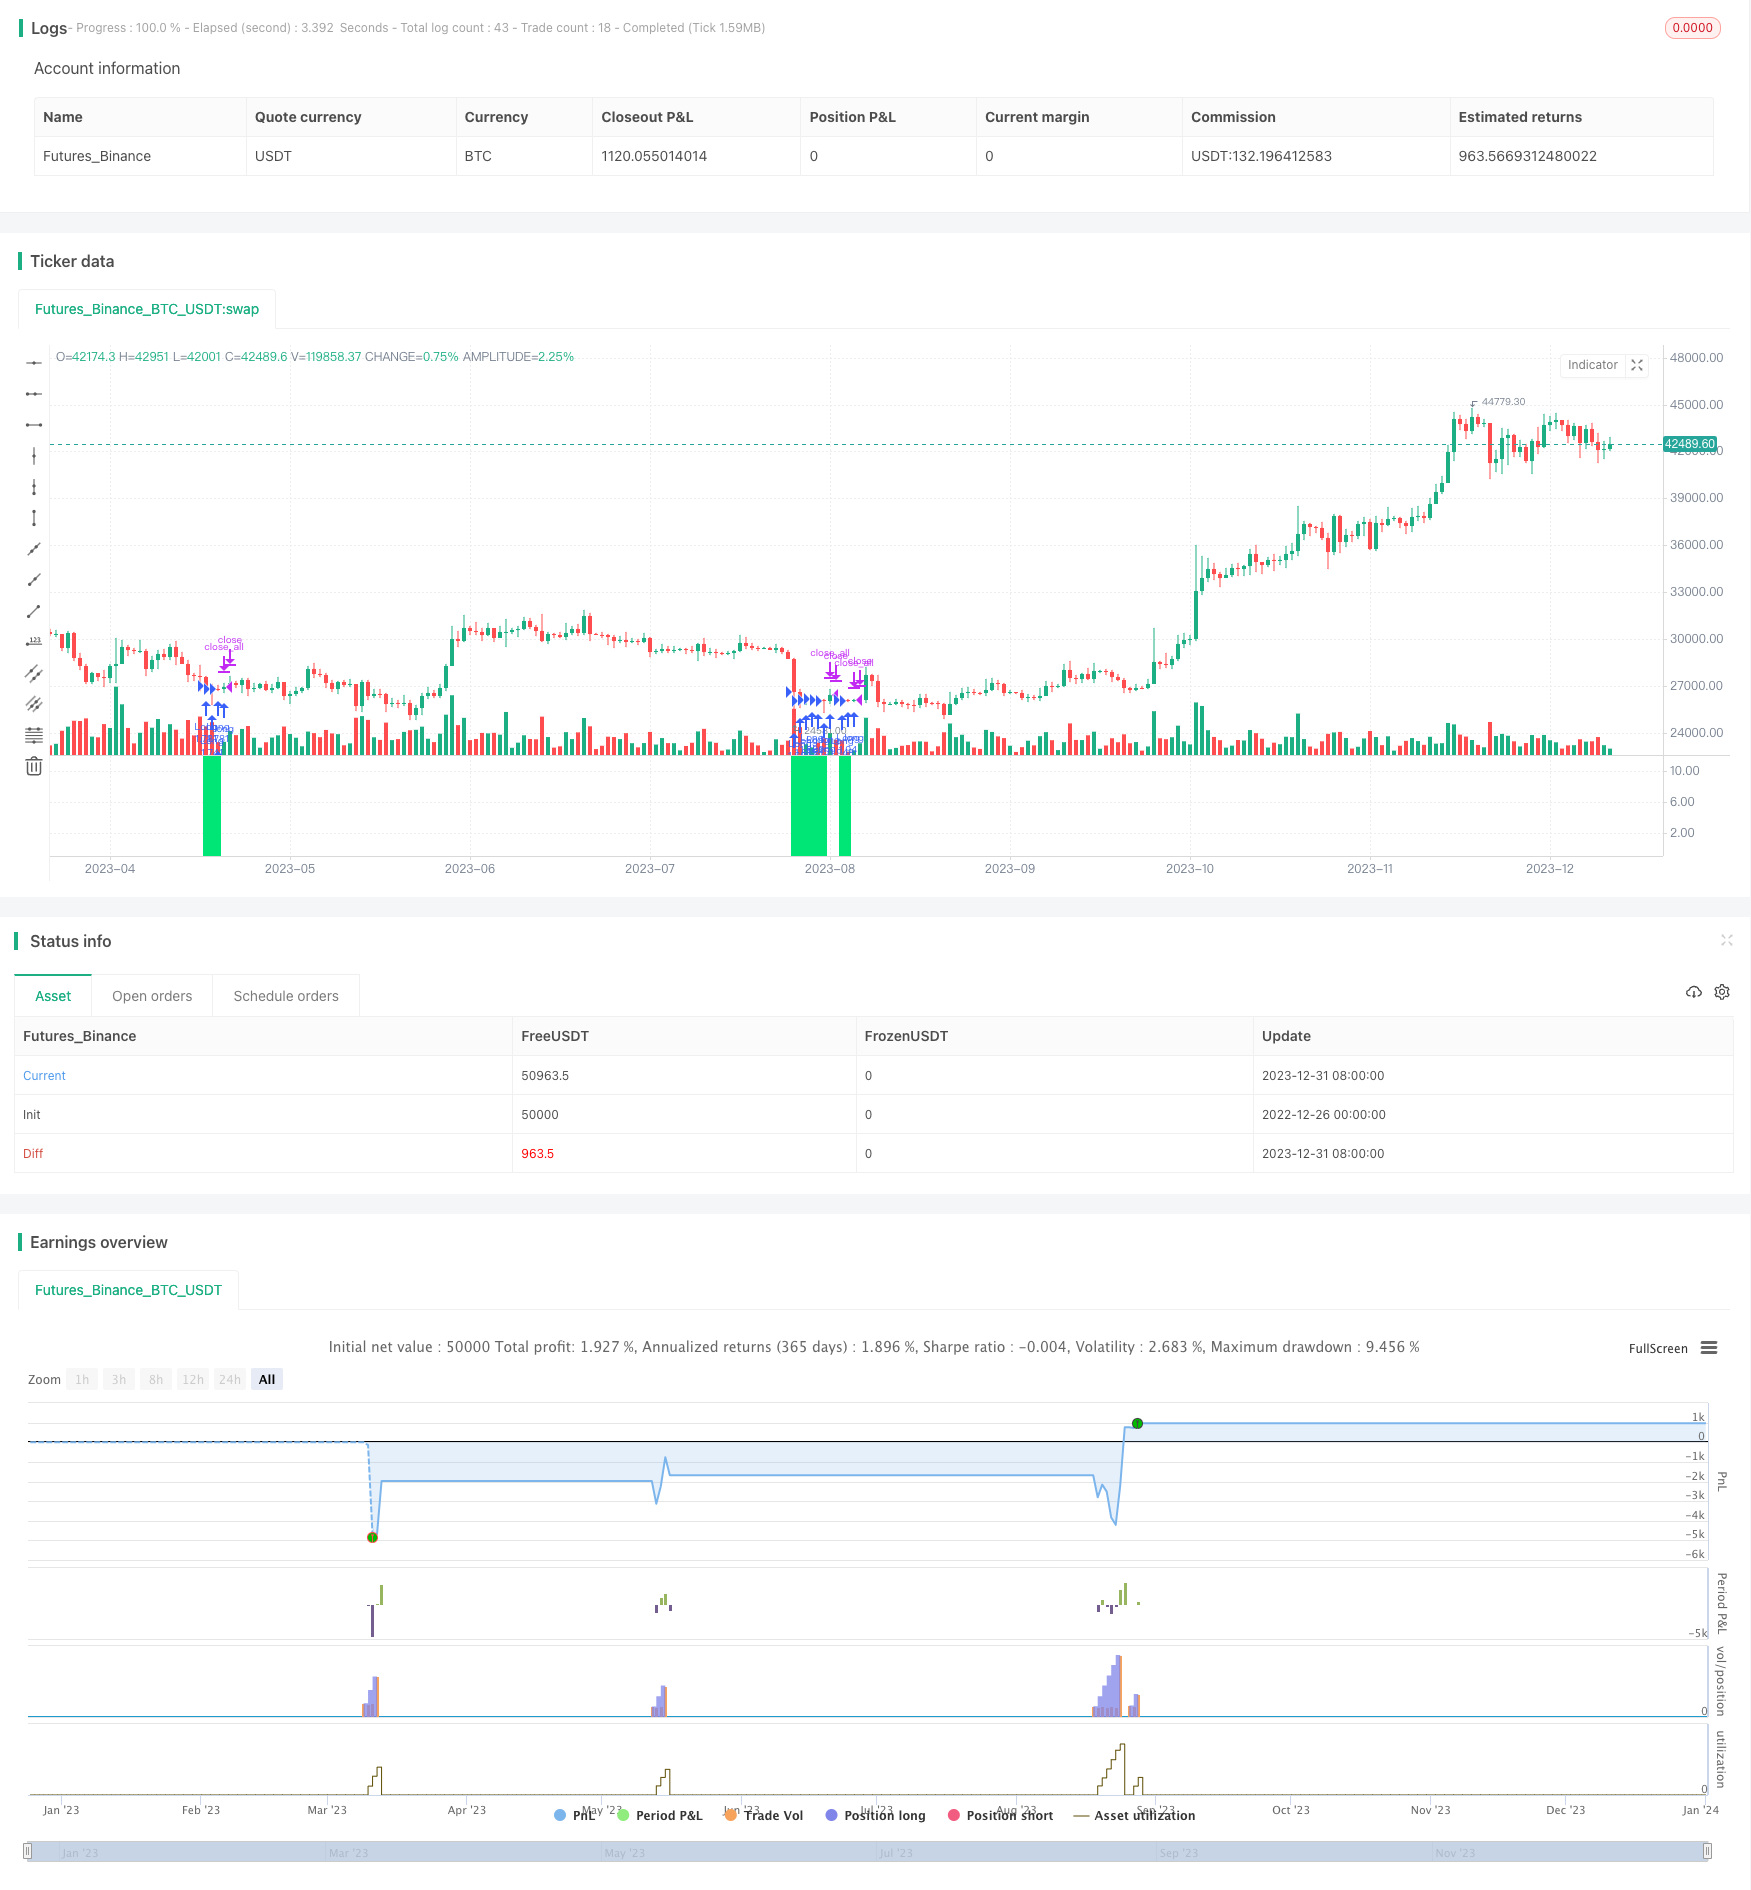
/*backtest
start: 2022-12-26 00:00:00
end: 2024-01-01 00:00:00
period: 1d
basePeriod: 1h
exchanges: [{"eid":"Futures_Binance","currency":"BTC_USDT"}]
*/

//Noro
//2018

//@version=2
strategy(title = "Noro's Symphony v1.0", shorttitle = "Symphony 1.0", overlay = false, default_qty_type = strategy.percent_of_equity, default_qty_value = 100, pyramiding = 20)

//Settings
needlong = input(true, defval = true, title = "Long")
needshort = input(true, defval = true, title = "Short")
capital = input(100, defval = 100, minval = 1, maxval = 10000, title = "Lot, %")
usersi1 = input(true, defval = true, title = "Use RSI 1")
rsiperiod1 = input(4, defval = 4, minval = 2, maxval = 100, title = "RSI 1 Period")
rsilimit1 = input(15, defval = 15, minval = 2, maxval = 50, title = "RSI 1 Limit")
usersi2 = input(true, defval = true, title = "Use RSI 2")
rsiperiod2 = input(7, defval = 7, minval = 2, maxval = 100, title = "RSI 2 Period")
rsilimit2 = input(20, defval = 20, minval = 2, maxval = 50, title = "RSI 2 Limit")
usersi3 = input(true, defval = true, title = "Use RSI 3")
rsiperiod3 = input(14, defval = 14, minval = 2, maxval = 100, title = "RSI 3 Period")
rsilimit3 = input(25, defval = 25, minval = 2, maxval = 50, title = "RSI 3 Limit")
usersi4 = input(true, defval = true, title = "Use RSI 4")
rsiperiod4 = input(21, defval = 21, minval = 2, maxval = 100, title = "RSI 4 Period")
rsilimit4 = input(30, defval = 30, minval = 2, maxval = 50, title = "RSI 4 Limit")
usersi5 = input(true, defval = true, title = "Use RSI 5")
rsiperiod5 = input(28, defval = 28, minval = 2, maxval = 100, title = "RSI 5 Period")
rsilimit5 = input(35, defval = 35, minval = 2, maxval = 50, title = "RSI 5 Limit")
cf = input(false, defval = false, title = "Use color filter")
fromyear = input(1900, defval = 1900, minval = 1900, maxval = 2100, title = "From Year")
toyear = input(2100, defval = 2100, minval = 1900, maxval = 2100, title = "To Year")
frommonth = input(01, defval = 01, minval = 01, maxval = 12, title = "From Month")
tomonth = input(12, defval = 12, minval = 01, maxval = 12, title = "To Month")
fromday = input(01, defval = 01, minval = 01, maxval = 31, title = "From Day")
today = input(31, defval = 31, minval = 01, maxval = 31, title = "To Day")

//RSI
rsi1 = rsi(close, rsiperiod1)
rsi2 = rsi(close, rsiperiod2)
rsi3 = rsi(close, rsiperiod3)
rsi4 = rsi(close, rsiperiod4)
rsi5 = rsi(close, rsiperiod5)

//Signals
up1 = rsi1 < rsilimit1 and usersi1
up2 = rsi2 < rsilimit2 and usersi2
up3 = rsi3 < rsilimit3 and usersi3
up4 = rsi4 < rsilimit4 and usersi4
up5 = rsi5 < rsilimit5 and usersi5

up = up1 or up2 or up3 or up4 or up5
exit = rsi1 > rsilimit1 and rsi2 > rsilimit2 and rsi3 > rsilimit3 and rsi4 > rsilimit4 and rsi5 > rsilimit5
lot = strategy.position_size == 0 ? strategy.equity / close * capital / 100 : lot[1]

//Background
col = up ? lime : na
bgcolor(col, transp = 0)

//Trading
if up and (close < open or cf == false)
    strategy.entry("Long", strategy.long, needlong == false ? 0 : lot)

if  exit
    strategy.close_all()