概述
该策略基于移动平均线的黄金交叉原理设计。具体来说,它使用两个不同周期的简单移动平均线,即50周期线和200周期线。当50周期线从下方突破200周期线时,产生买入信号;当50周期线从上方跌破200周期线时,产生卖出信号。
策略原理
该策略使用 Pine Script 语言编写,主要逻辑如下:
- 计算两个SMA:50周期SMA和200周期SMA
- 判断黄金交叉:当50周期SMA上穿200周期SMA时,做多
- 判断死亡交叉:当50周期SMA下穿200周期SMA时,平仓
这里使用SMA指标的重要性在于,它能有效滤除行情数据的噪音, Capture长期趋势。快速 SMA 线上穿慢速 SMA 线,表示短期上涨势头打败了长期的下跌趋势,买入信号产生。
策略优势
该策略具有以下几个优势:
- 原理简单易懂,容易实现。
- PARAMETERS设置合理,可自定义两个SMA周期,适应不同市场。
- 采用stable版本Pine语言编写,运行高效。
- 可视化设置信息丰富,易于使用。
风险及解决
该策略也存在一些风险:
可能出现假突破,使策略产生错误信号。可适当调整两个SMA参数,降低假突破概率。
无法响应短期市场,只适合长线投资者。可适当缩短快速SMA的周期。
回撤可能较大。可设置止损点,或适当调整仓位管理。
优化思路
该策略可从以下几个维度继续优化:
增加其他指标过滤,组合多个买入/卖出条件,降低假信号概率。
增加止损机制。当价格跌破某一水平时,强制止损。
优化仓位管理。例如随着趋势加仓,跟踪止损等。控制回撤并追求更高收益。
进行参数优化。评估不同参数对收益风险比的影响。
总结
该策略总的来说是一个典型的趋势跟踪策略。它利用 SMA 的优势,简单高效地 Capture长线趋势。可根据自己的风格和参数调整空间进行定制。同时也需要注意一些已有的不足,进行进一步的优化与改进。
策略源码
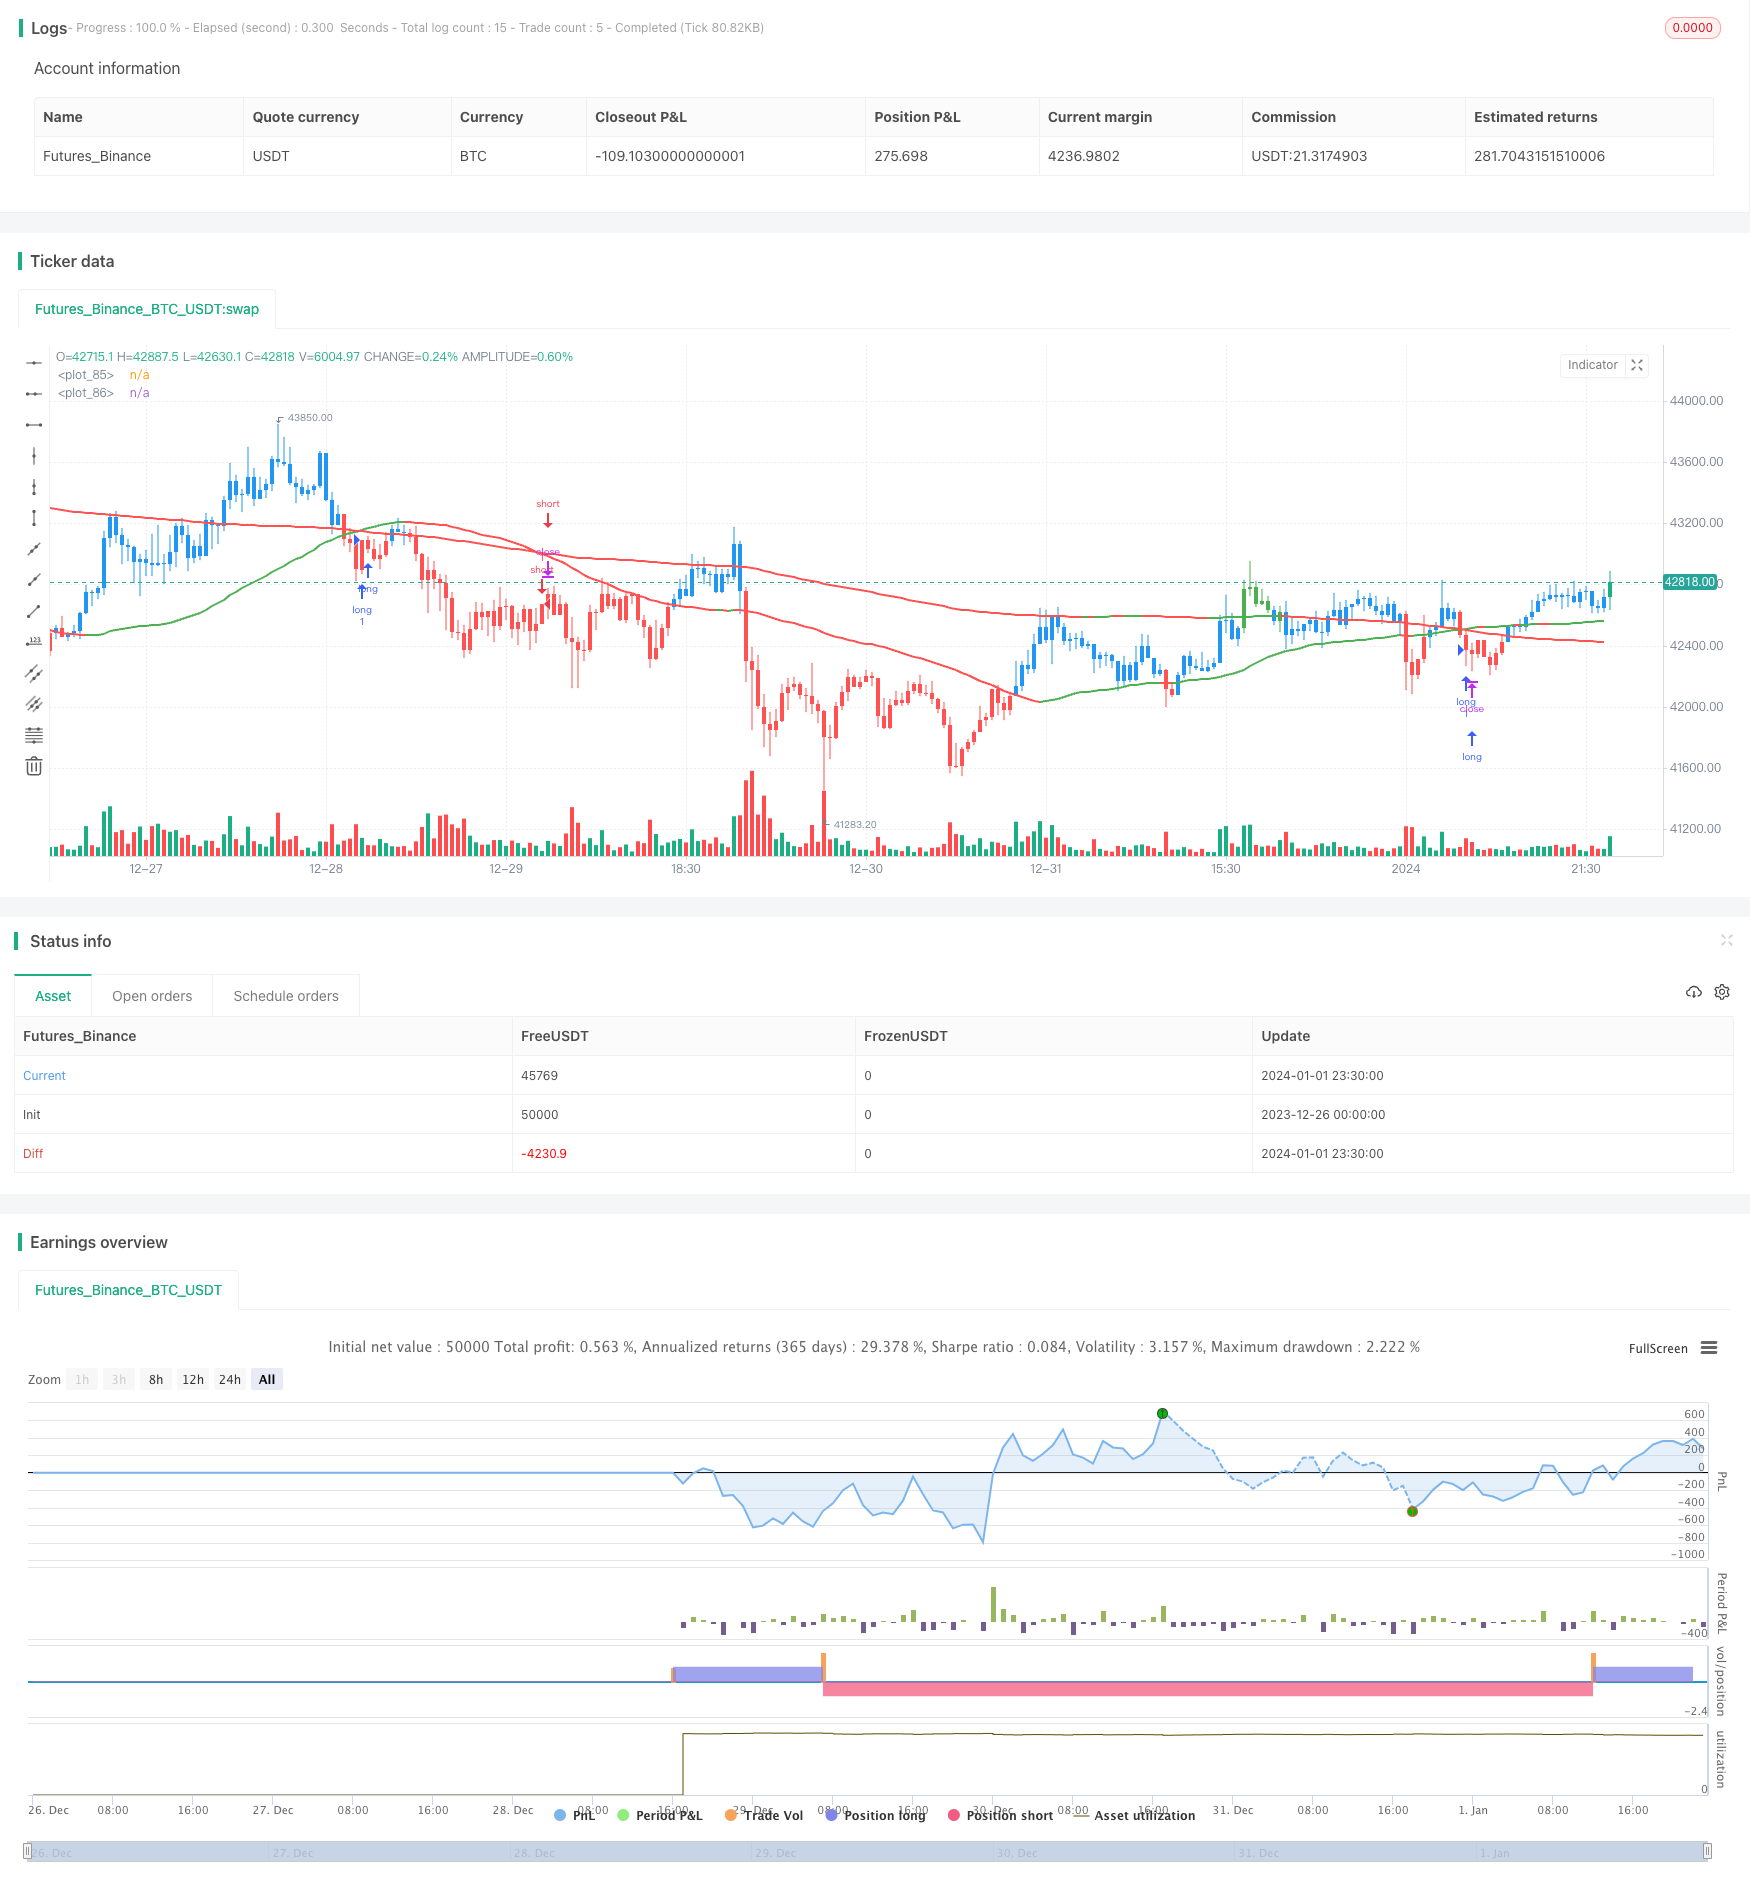
/*backtest
start: 2023-12-26 00:00:00
end: 2024-01-02 00:00:00
period: 30m
basePeriod: 15m
exchanges: [{"eid":"Futures_Binance","currency":"BTC_USDT"}]
*/

// @version=4
//
// This source code is subject to the terms of the Mozilla Public License 2.0 at https://mozilla.org/MPL/2.0/
// www.tradingview.com/u/TradeFab/
// www.tradefab.com
// ___  __        __   __  __       __
//  |  |__)  /\  |  \ |__ |__  /\  |__)
//  |  |  \ /~~\ |__/ |__ |   /~~\ |__)
//
// DISCLAIMER: Futures, stocks and options trading involves substantial risk of loss
// and is not suitable for every investor. You are responsible for all the risks and
// financial resources you use and for the chosen trading system.
// Past performance is not indicative for future results. In making an investment decision,
// traders must rely on their own examination of the entity making the trading decisions!
//
// TradeFab's Golden Cross Strategy.
// The strategy goes long when the faster SMA 50 (the simple moving average of the last 50 bars) crosses
// above the SMA 200. Orders are closed when the SMA 50 crosses below SMA 200. The strategy does not short.
//
VERSION = "1.2"
// 1.2 FB 2020-02-09 converted to Pine version 4
// 1.1 FB 2017-01-15 added short trading
// 1.0 FB 2017-01-13 basic version using SMAs
//
strategy(
   title        = "TFs Golden Cross " + VERSION,
   shorttitle   = "TFs Golden Cross " + VERSION,
   overlay      = true
   )


///////////////////////////////////////////////////////////
// === INPUTS ===
///////////////////////////////////////////////////////////
inFastSmaPeriod     = input(title="Fast SMA Period", type=input.integer, defval=50, minval=1)
inSlowSmaPeriod     = input(title="Slow SMA Period", type=input.integer, defval=200, minval=1)

// backtest period
testStartYear       = input(title="Backtest Start Year",    type=input.integer, defval=2019, minval=2000)
testStartMonth      = input(title="Backtest Start Month",   type=input.integer, defval=1, minval=1, maxval=12)
testStartDay        = input(title="Backtest Start Day",     type=input.integer, defval=1, minval=1, maxval=31)
testStopYear        = input(title="Backtest Stop Year",     type=input.integer, defval=2099, minval=2000)
testStopMonth       = input(title="Backtest Stop Month",    type=input.integer, defval=12, minval=1, maxval=12)
testStopDay         = input(title="Backtest Stop Day",      type=input.integer, defval=31, minval=1, maxval=31)


///////////////////////////////////////////////////////////
// === LOGIC ===
///////////////////////////////////////////////////////////
smaFast = sma(close, inFastSmaPeriod)
smaSlow = sma(close, inSlowSmaPeriod)

bullishCross = crossover (smaFast, smaSlow)
bearishCross = crossunder(smaFast, smaSlow)

// detect valid backtest period
isTestPeriod() => true


///////////////////////////////////////////////////////////
// === POSITION EXECUTION ===
///////////////////////////////////////////////////////////
strategy.entry("long",  strategy.long,  when=bullishCross)
strategy.entry("short", strategy.short, when=bearishCross)


///////////////////////////////////////////////////////////
// === PLOTTING ===
///////////////////////////////////////////////////////////
// background color
nopColor = color.new(color.gray, 50)
bgcolor(not isTestPeriod() ? nopColor : na)

bartrendcolor =
   close > smaFast and
   close > smaSlow and
   change(smaSlow) > 0
       ? color.green
       : close < smaFast and
         close < smaSlow and
         change(smaSlow) < 0
             ? color.red
             : color.blue
barcolor(bartrendcolor)
plot(smaFast, color=change(smaFast) > 0 ? color.green : color.red, linewidth=2)
plot(smaSlow, color=change(smaSlow) > 0 ? color.green : color.red, linewidth=2)

// label
posColor = color.new(color.green, 75)
negColor = color.new(color.red, 75)
dftColor = color.new(color.blue, 75)
posProfit= (strategy.position_size != 0) ? (close * 100 / strategy.position_avg_price - 100) : 0.0
posDir   = (strategy.position_size  > 0) ? "long" : strategy.position_size < 0 ? "short" : "flat"
posCol   = (posProfit > 0) ? posColor : (posProfit < 0) ? negColor : dftColor

var label lb = na
label.delete(lb)
lb := label.new(bar_index, max(high, highest(5)[1]),
   color=posCol,
   text="Pos: "+ posDir +
      "\nPnL: "+tostring(posProfit, "#.##")+"%" +
      "\nClose: "+tostring(close, "#.##"))