概述
KP移动平均趋势策略是一种技术分析指标组合的趋势跟踪策略。该策略主要利用平均线指标识别价格趋势方向,采用均线交叉信号判断入场 timing。策略可在 TradingView 平台上实现,通过参数优化获得较好的表现。
策略原理
KP策略主要运用三类指标:
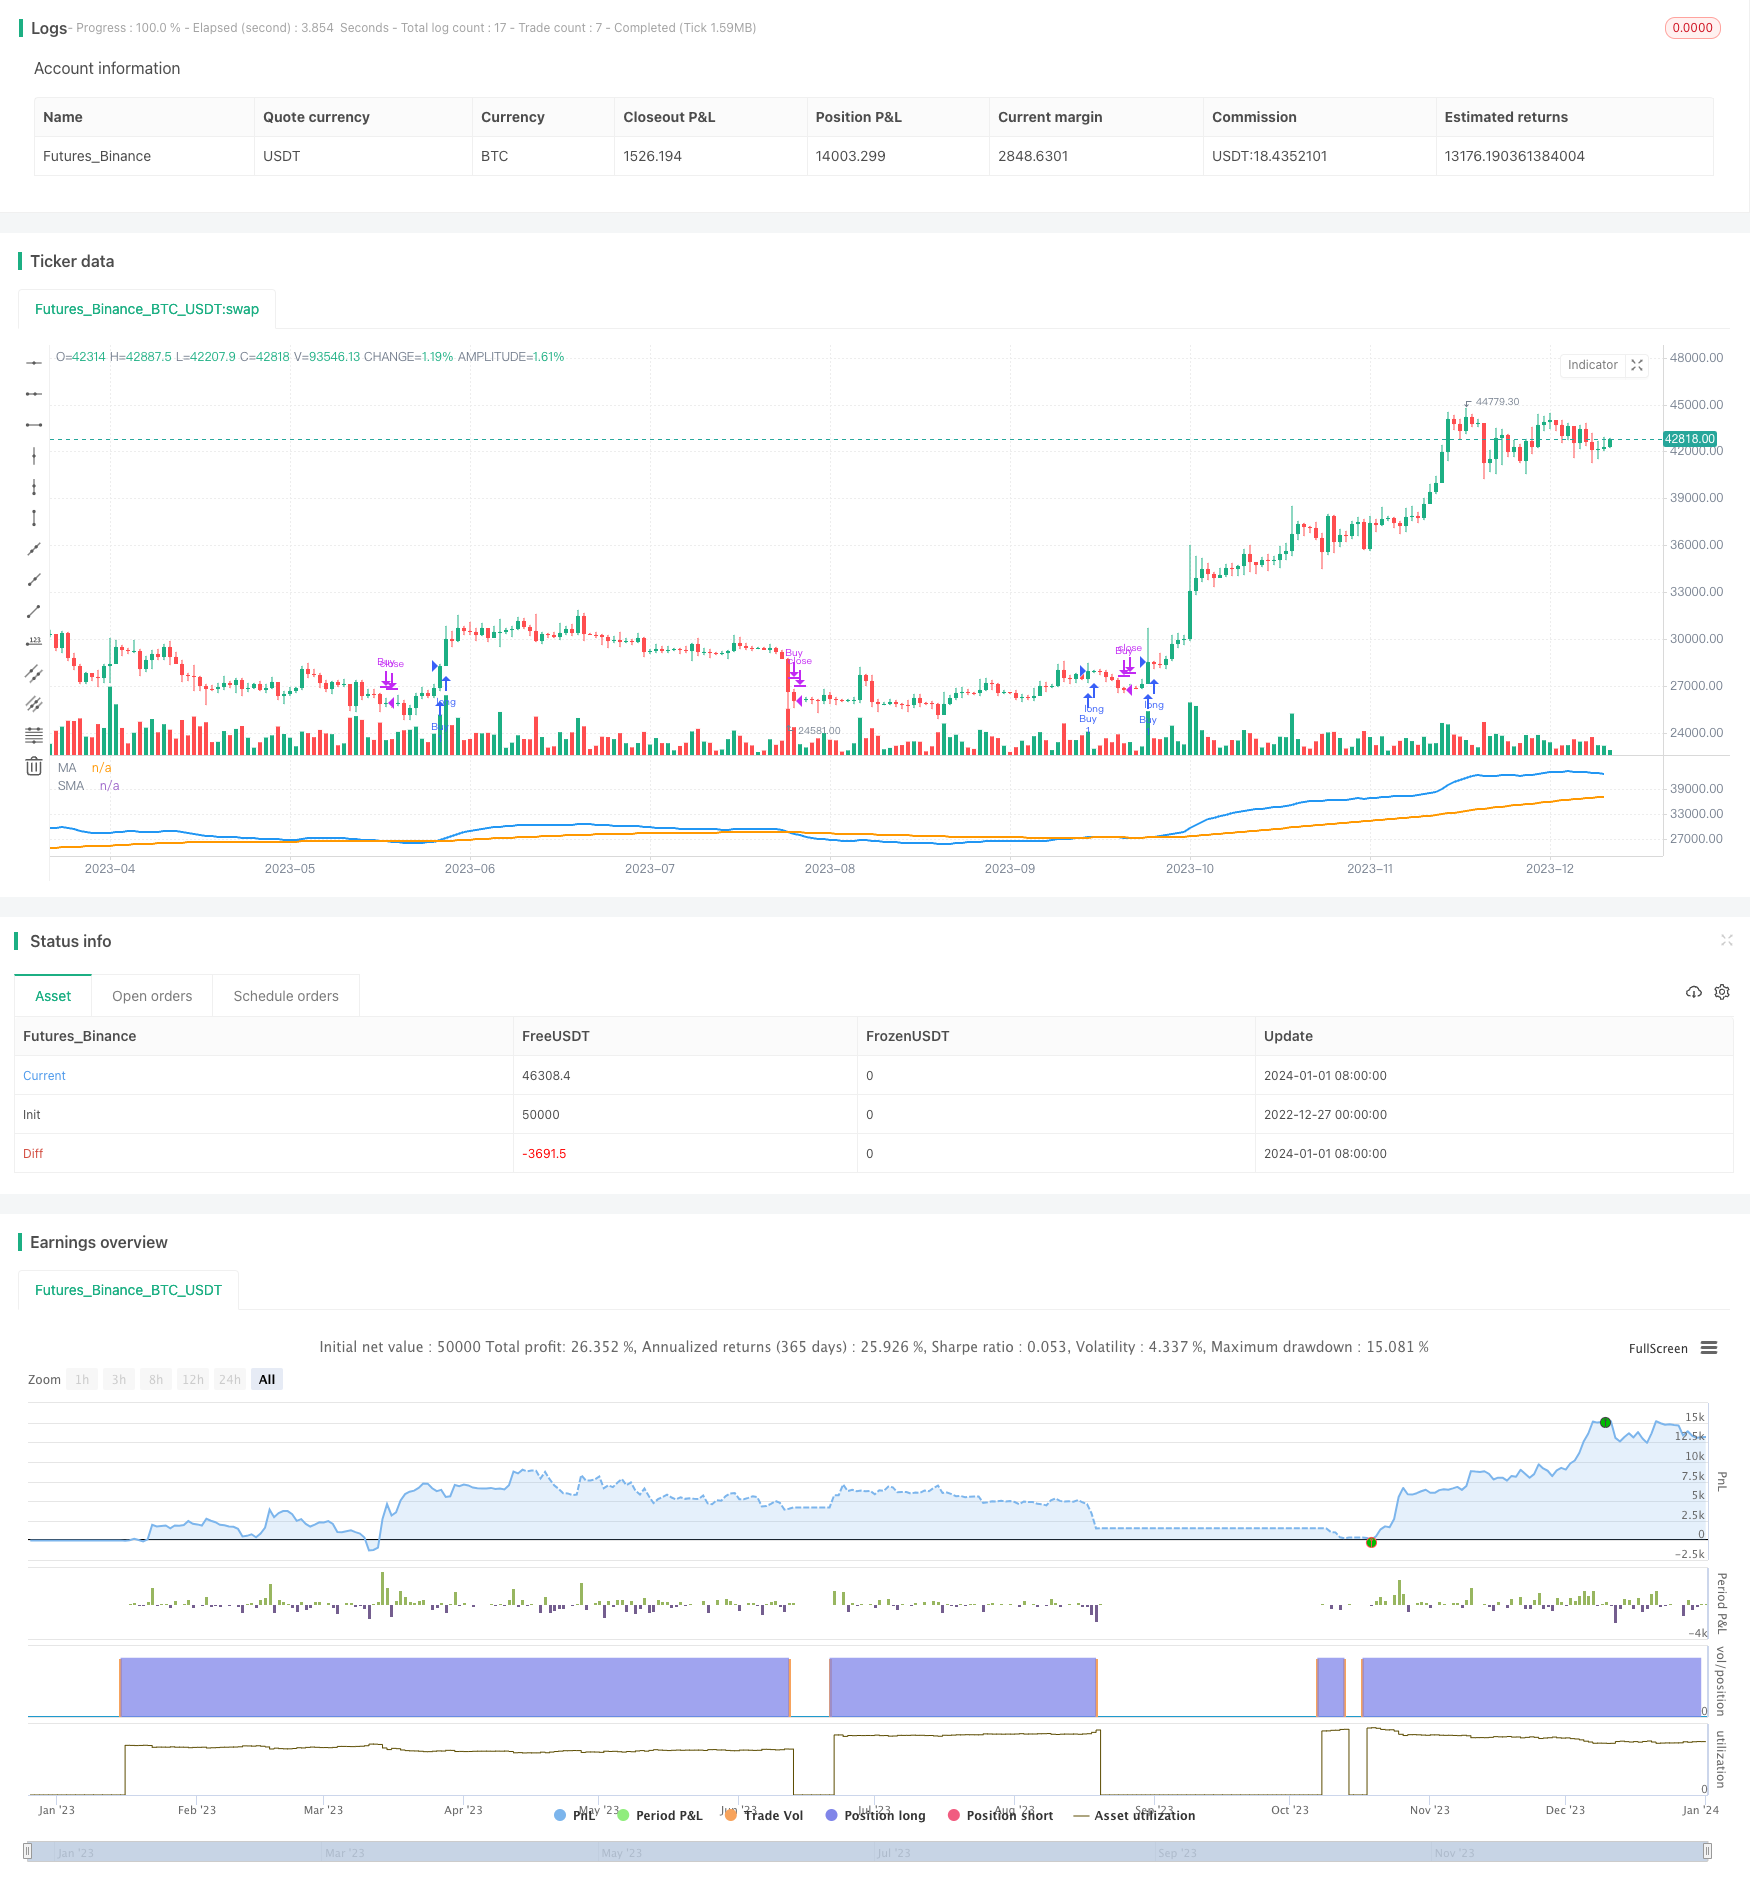
平均线:快速EMA 和慢速SMA。EMA反应价格变化更为敏感,SMA更稳定。两者配合使用,快速EMA交叉慢速SMA产生交易信号。
希肯阿修蜡烛图:特殊的烛形图,有更清晰的趋势特征。策略中用于绘制EMA均线的价格数据来源。
对数变换选项:对价格数据做可选的对数变换,更便于观察百分比价格变动。
具体交易逻辑是,快速EMA向上突破慢速SMA时做多;向下跌破时平仓。该策略属于典型的趋势跟踪策略。
优势分析
- 参数可调性强,能适应不同品种和交易时段
- 可视化指标配合,形成清晰易读的趋势交易策略
- 增加对数变换可选项,应对更加波动的品种
- 希肯阿修蜡烛图更好判定趋势方向
- 整合停损机制控制风险
风险分析
- 趋势反转风险,需要及时止损
- 参数优化需谨慎,避免过拟合
- 交易品种和时段选择对策略表现影响大
- 需进行充分回测确保参数稳健性
优化方向
- 增加自适应参数优化模块
- 整合更多指标过滤假信号
- 增加算法交易模块,实现自动化下单
- 结合机器学习技术判断关键点
- 优化止损策略,实现动态跟踪止损
总结
KP移动平均趋势策略整合多种技术指标判断趋势方向,参数设置灵活,可视化效果出色。该策略可作为基础趋势跟踪策略,进行适当优化调整后用于实盘交易。但用户须谨记,任何策略都不能完美预测市场,需控制风险,审慎操作。
策略源码
/*backtest
start: 2022-12-27 00:00:00
end: 2024-01-02 00:00:00
period: 1d
basePeriod: 1h
exchanges: [{"eid":"Futures_Binance","currency":"BTC_USDT"}]
*/

//@version=5
strategy("KP 15min Strategy", shorttitle="KP15", overlay=false)

res = input("D",title="Heikin Ashi Candle Time Frame")
hshift = input(0, title="Heikin Ashi Candle Time Frame Shift")
res1 = input("W",title="Heikin Ashi EMA Time Frame")
mhshift = input(0, title="Heikin Ashi EMA Time Frame Shift")
fama = input(10, title="Heikin Ashi EMA Period")
test = input(0, title="Heikin Ashi EMA Shift")
sloma = input(100, title="Slow EMA Period")
slomas = input(0, title="Slow EMA Shift")
logtransform = input(false, title="Log Transform")
stoploss = input(true, title="Stop Loss")
showplots = input(true, title="Show Plots")

ha_t = request.security(syminfo.tickerid, res, expression=hlc3)
ha_close = request.security(syminfo.tickerid, res, expression=logtransform ? math.log(close[hshift]) : close[hshift])
mha_close = request.security(syminfo.tickerid, res1, expression=logtransform ? math.log(close[mhshift]) : close[mhshift])

fma = ta.ema(mha_close[test], fama)
sma = ta.ema(ha_close[slomas], sloma)

plot(showplots ? (logtransform ? math.exp(fma) : fma) : na, title="MA", color=color.new(color.blue, 0), linewidth=2, style=plot.style_line)
plot(showplots ? (logtransform ? math.exp(sma) : sma) : na, title="SMA", color=color.new(color.orange, 0), linewidth=2, style=plot.style_line)

golong = ta.crossover(fma, sma)
exitLong = ta.crossunder(fma, sma)

if (golong)
    strategy.entry("Buy", strategy.long)

if (exitLong)
    strategy.close("Buy")