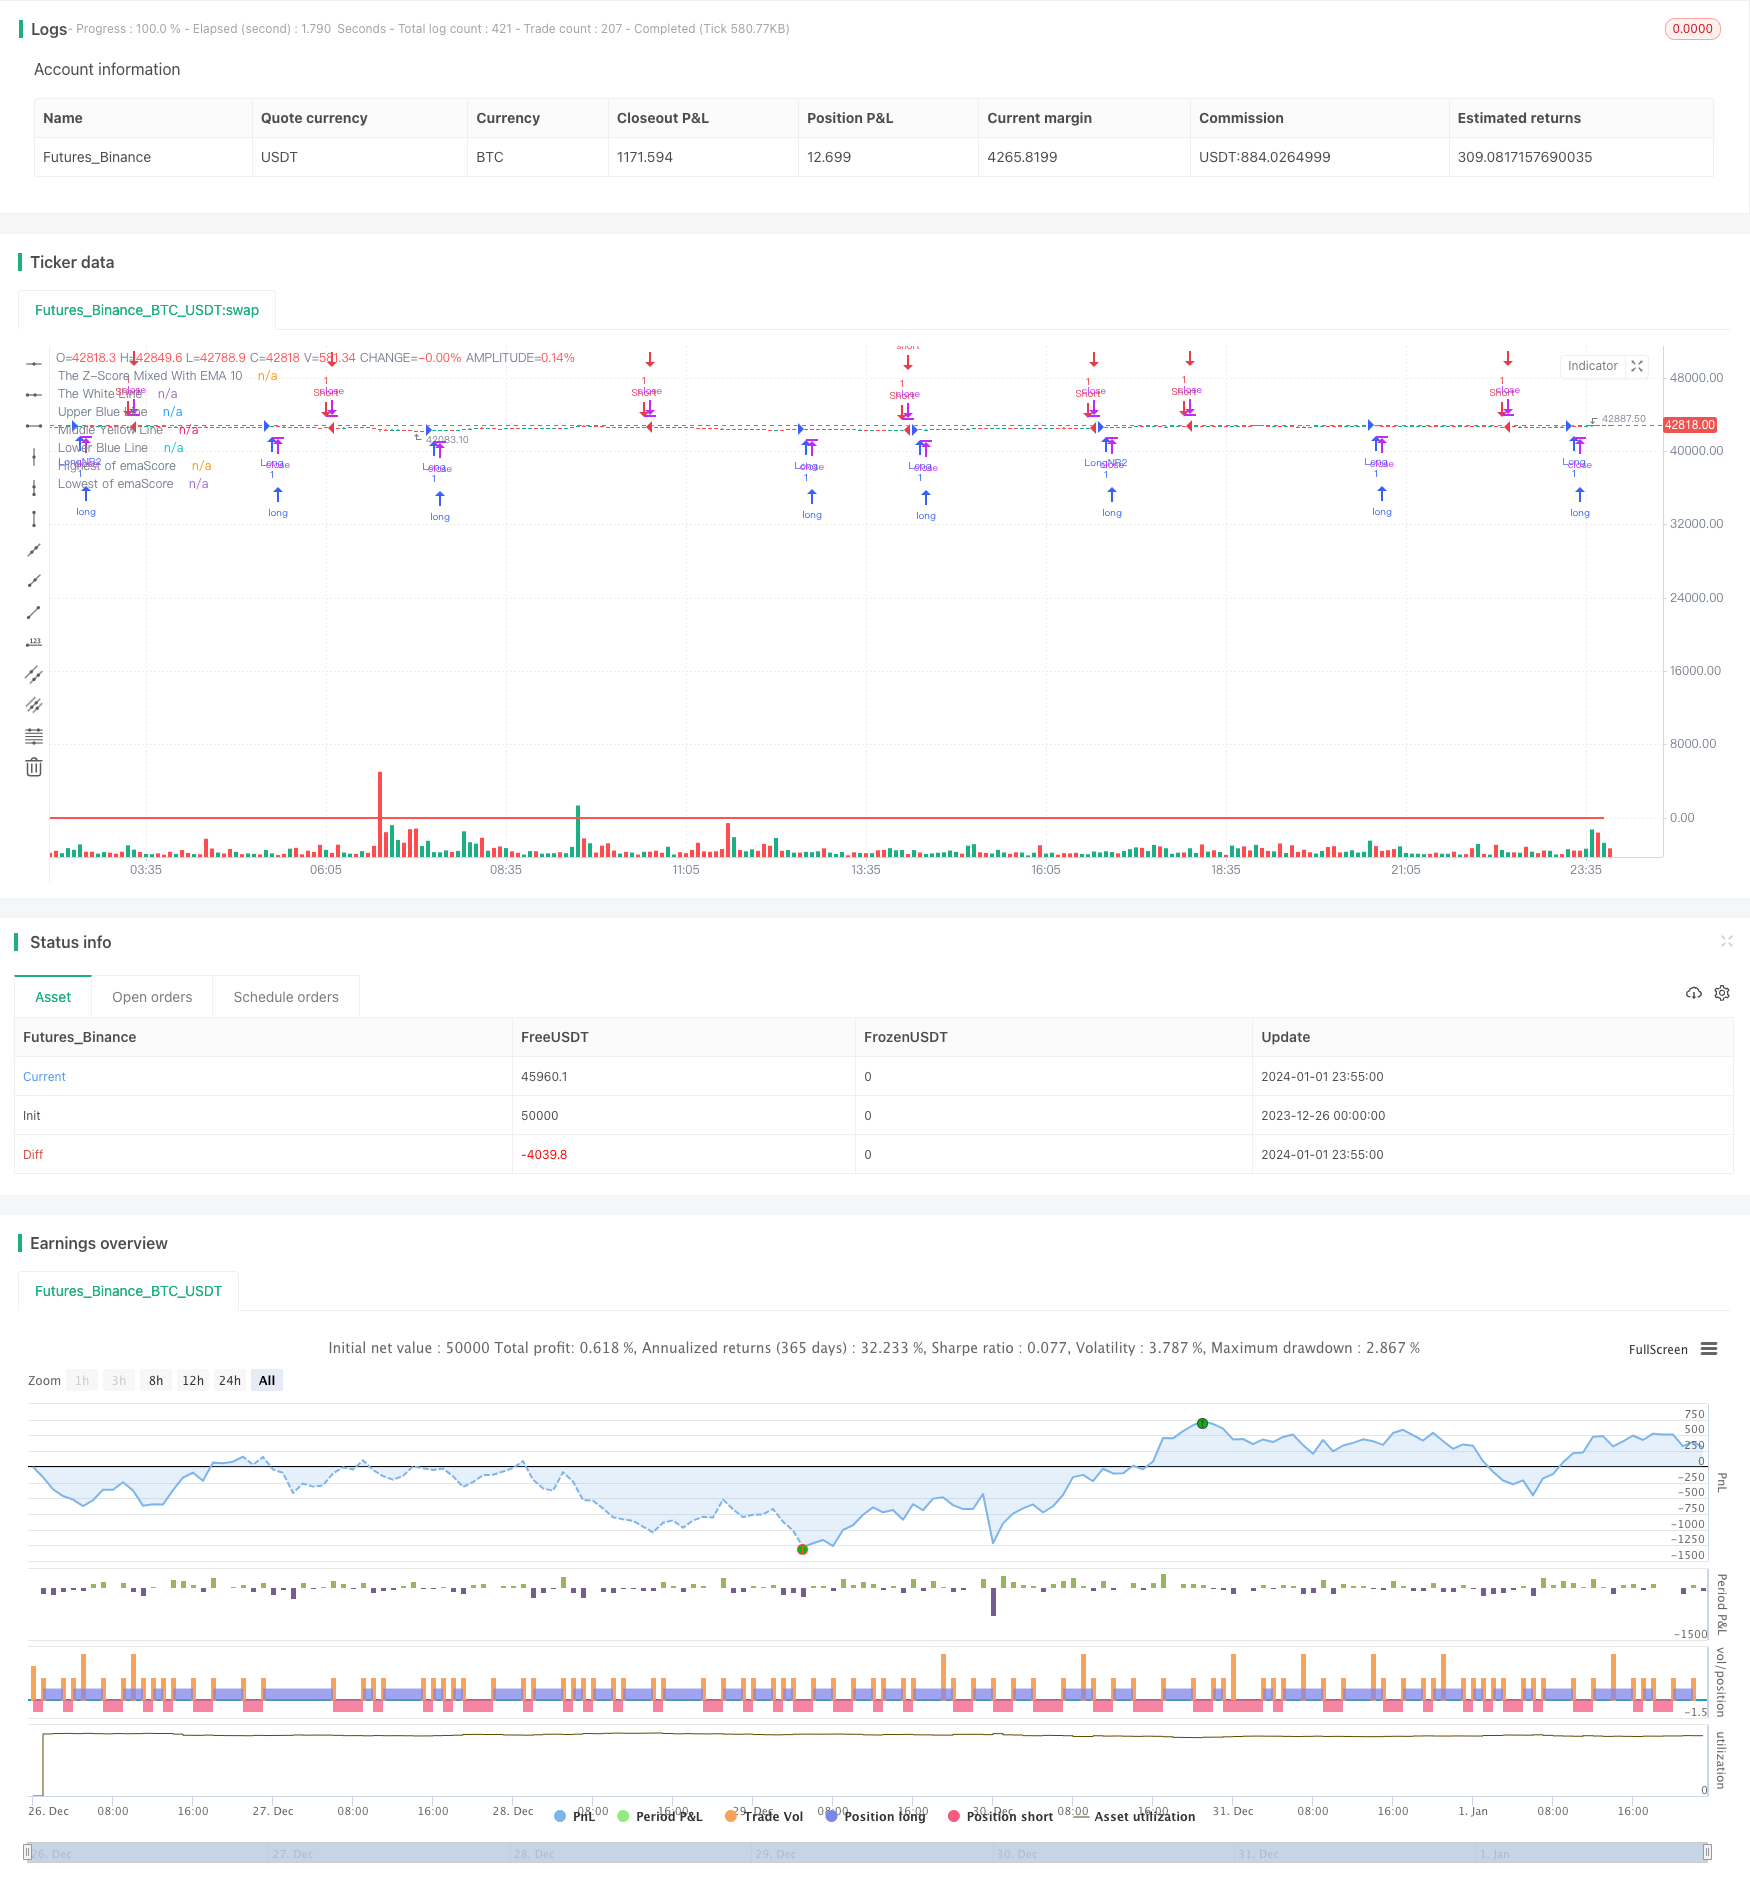
概述
该策略运用高斯分布的思想,基于海克力蜡烛的10周期指数移动平均线计算Z值,再对该Z值的20周期指数移动平均线设定阈值,根据曲线穿越的情况判断建仓与平仓。
策略原理
计算海克力蜡烛收盘价的10周期指数移动平均线。
基于上述移动平均线数据,计算25周期内的Z值。Z值反映数据偏离平均值的标准差个数,可判断数据是常态还是异常。
对Z值的20周期指数移动平均线再次计算,得到曲线emaScore。该曲线反映了Z值的长期趋势。
根据emaScore数据的分布情况,设定上下阈值。考虑到曲线会有一定波动,这里选取分布的90%和10%数据作为阈值。
当emaScore上穿中线或下阈值时,做多;当emaScore下穿上阈值、下阈值或100周期内最高点时,做空。
优势分析
应用高斯分布思想,通过Z值判断常态性,可过滤假突破。
双层滤波,运算exeScore曲线,判断长期趋势EXTENSIVE511.
设定合理的阈值,降低错误交易概率。
结合百周期最高最低点,可抓住反转机会。
风险分析
Z值与移动平均线组合使用,对参数敏感,需要优化。
阈值设定合理与否关系巨大,过宽或过窄都会失效。
百周期最高最低点容易产生错误信号,可适当放宽触发条件。
海克力蜡烛本身就有一定滞后,需评估是否适合该策略。
优化方向
测试不同周期的移动平均线、Z值参数。
利用walk forward analysis方法自动优化参数。
尝试不同的阈值设定方法,如标准差倍数。
改进最高最低点判断逻辑,防止错误信号。
尝试其他类型蜡烛或典型价格等替代海克力蜡烛。
总结
该策略基于高斯分布的思想,通过双重指数移动平均和动态阈值设定,有效判断价格异常并产生交易信号。主要优势是可过滤假突破,抓住反转。但参数设置和组合运用都对结果影响巨大,仍需继续测试与优化,寻找最佳参数与组合方式。
策略源码
/*backtest
start: 2023-12-26 00:00:00
end: 2024-01-02 00:00:00
period: 5m
basePeriod: 1m
exchanges: [{"eid":"Futures_Binance","currency":"BTC_USDT"}]
*/


// This source code is subject to the terms of the Mozilla Public License 2.0 at https://mozilla.org/MPL/2.0/
// © jensenvilhelm

// Here is an attempt to create a robust strategy for BTCUSD on a 5 minute chart
// I can't seem to get this code to work the way i want.... if you want to give it a try, please let me know -
// how it goes in comment section.

//@version=5
// Define the strategy settings
strategy("The Z-score", shorttitle="TZS", overlay=true)

// User can set the start date for the strategy
startDate = timestamp("2023 06 01")

// Heikin-Ashi Open, Close, High and Low calculation
haClose = ohlc4
var float haOpen = na
haOpen := na(haOpen[1]) ? (open + close) / 2 : (haOpen[1] + haClose[1]) / 2
haHigh = math.max(nz(haOpen, high), nz(haClose, high), high)
haLow = math.min(nz(haOpen, low), nz(haClose, low), low)

// Function to calculate the Z-Score
z_score(_series, _length) =>
    _mean = ta.sma(_series, _length)
    _stddev = ta.stdev(_series, _length)
    (_series - _mean) / _stddev

// Compute the score and its EMA
score = z_score(ta.ema(haClose, 10), 25)
emaScore = ta.ema(score, 20)

// Calculate lower and upper thresholds using percentiles of EMA
lowerBlue = ta.percentile_linear_interpolation(emaScore, 50, 10)
upperBlue = ta.percentile_linear_interpolation(emaScore, 50, 90)

// Calculate the middle line as 50th percentile
middleLine = ta.percentile_linear_interpolation(emaScore, 50, 50)

// Plot the EMA of the score and the thresholds
plot(emaScore,"The White Line", color=color.white, linewidth=2)
plot(lowerBlue,"Lower Blue Line", linewidth=2)
plot(upperBlue, "Upper Blue Line", linewidth=2)
plot(middleLine, "Middle Yellow Line", linewidth=2, color=color.yellow)
plot(score,"The Z-Score Mixed With EMA 10", color=color.green)

// Calculate highest and lowest EMA score over 100 bars period
highest = ta.highest(emaScore, 100)
lowest = ta.lowest(emaScore, 100)

// Plot highest and lowest EMA score lines
plot(highest, "Highest of emaScore", color=color.red, linewidth=2)
plot(lowest, "Lowest of emaScore", color=color.red, linewidth=2)

// Define entry and exit conditions for long and short positions
longCon = ta.crossover(score, lowerBlue) or ta.crossover(emaScore, middleLine)
addOn = ta.crossover(score, highest)
shortCon = ta.crossunder(emaScore, upperBlue) or ta.crossunder(emaScore, lowerBlue) or ta.crossunder(emaScore, highest)

// Execute trading logic based on conditions and after the start date
if (time >= startDate)
    if longCon
        strategy.entry("Long", strategy.long)
        if shortCon
            strategy.close("Long")
    if addOn
        strategy.entry("LongNR2", strategy.long)
        if shortCon
            strategy.close("LongNR2")

    if shortCon
        strategy.entry("Short", strategy.short)
        if longCon
            strategy.close("Short")