概述
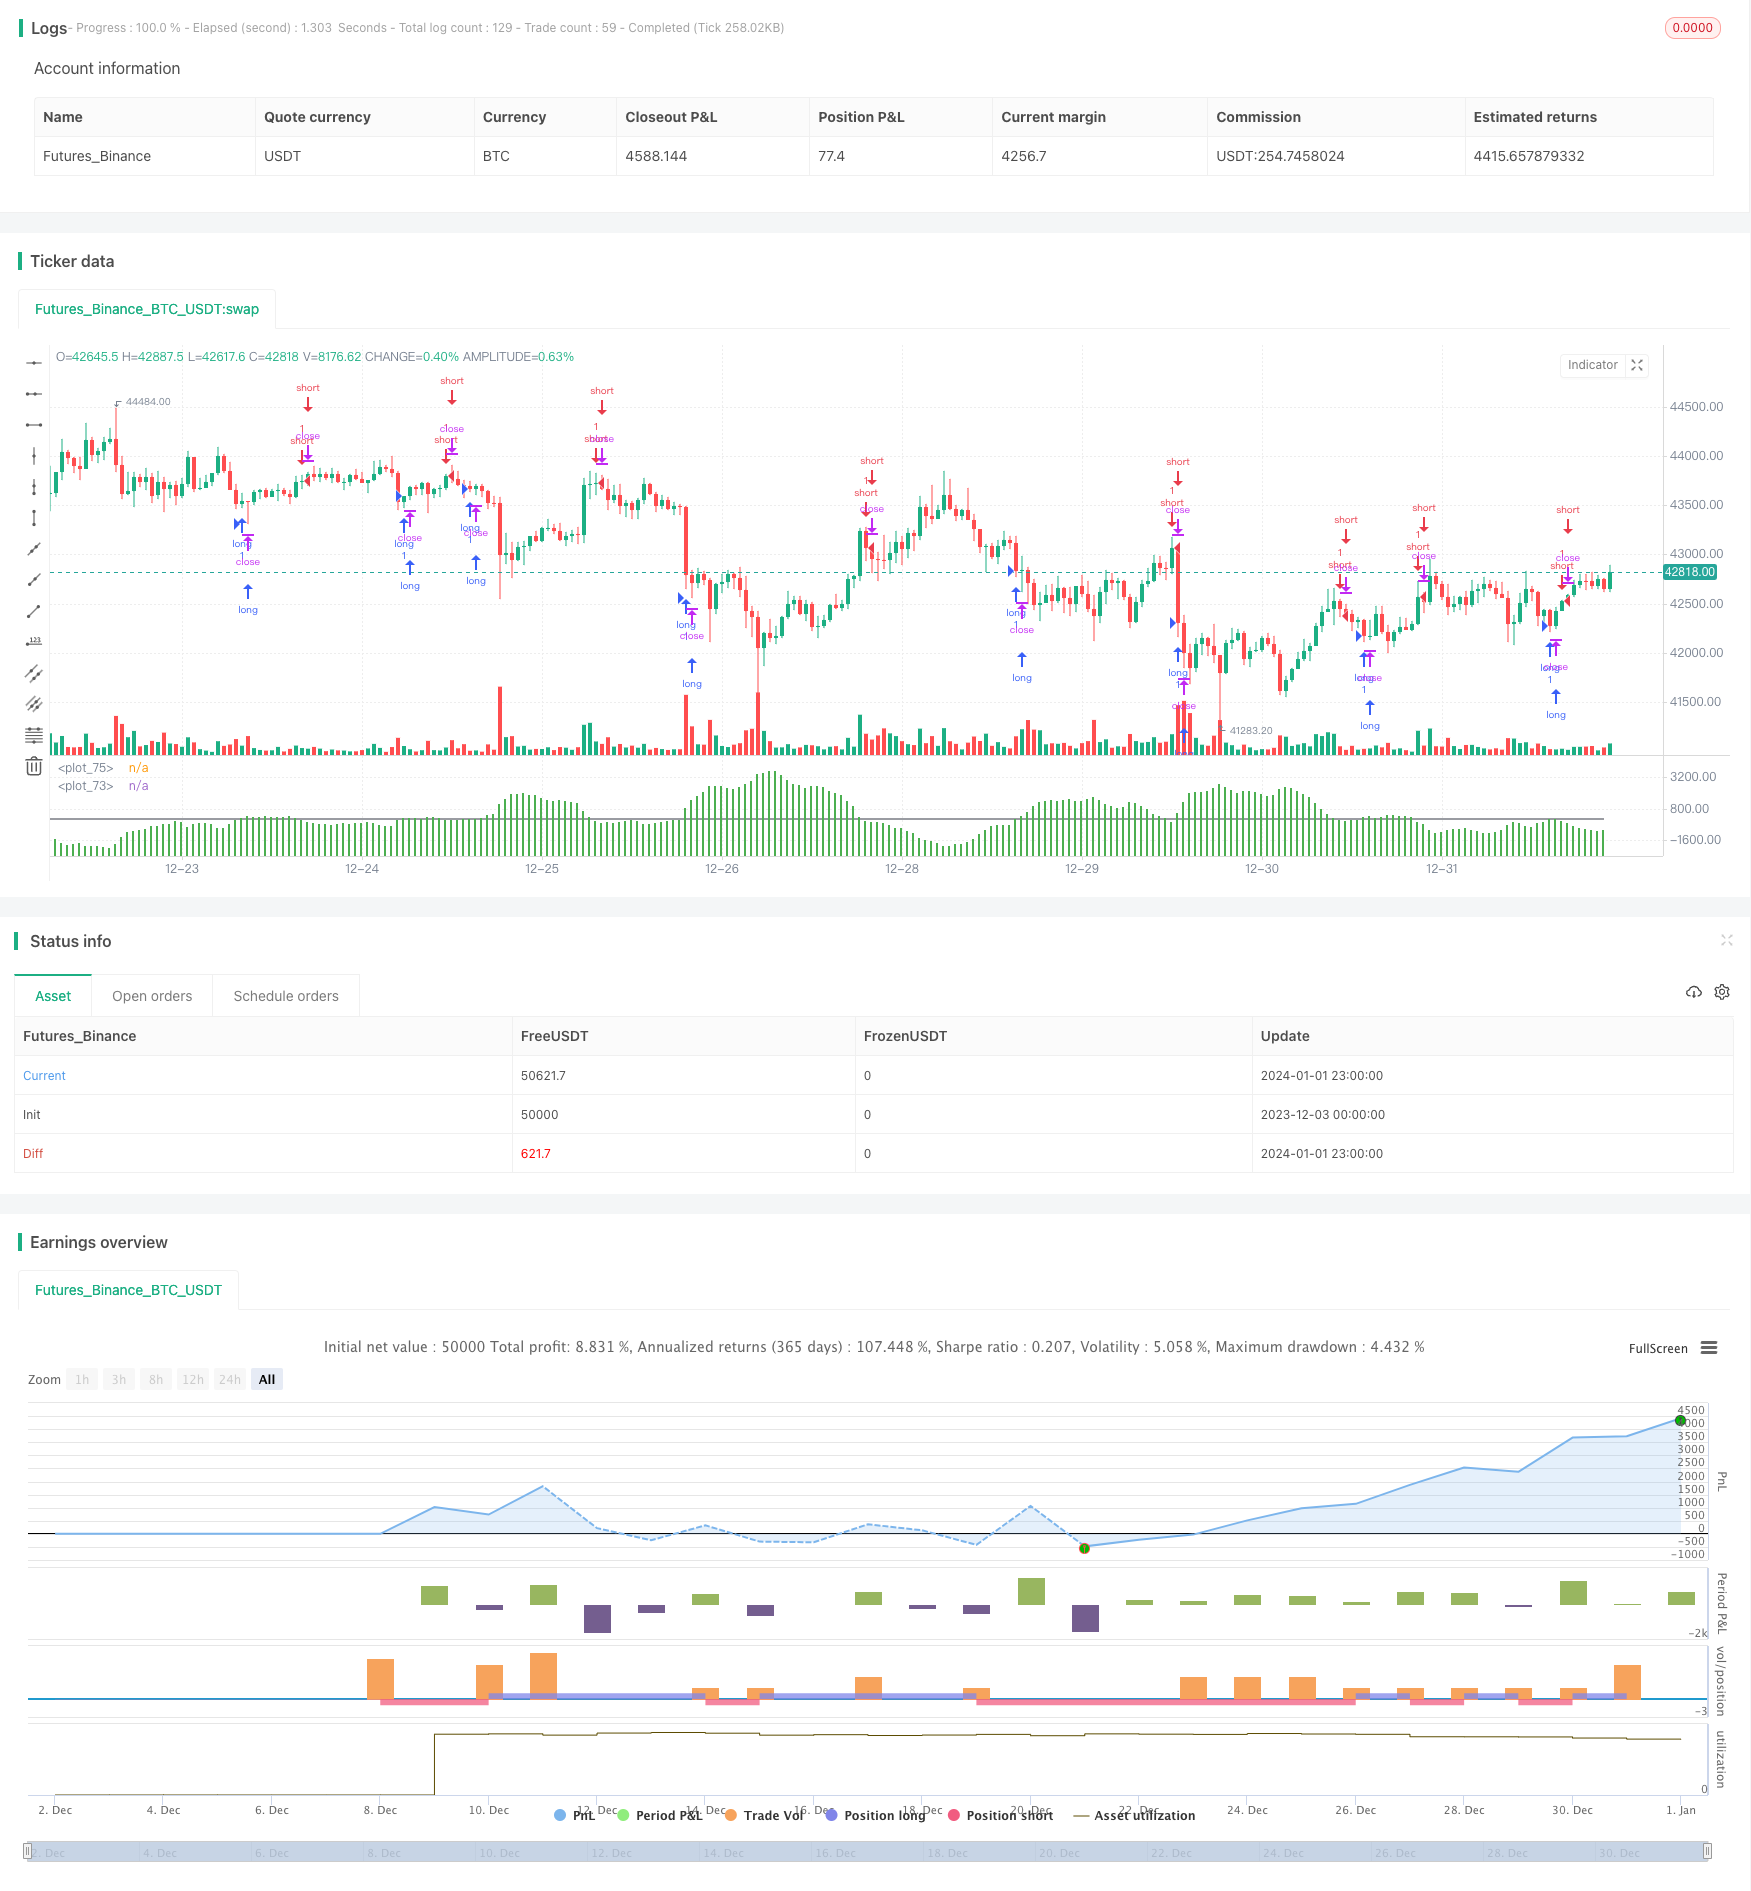
本策略通过构建多个不同周期的EMA指标,并计算其差值,形成格林美指标,用于判断价格趋势和发出交易信号。该策略适用于短期趋势跟踪,可以有效捕捉价格变化趋势。
策略原理
该策略首先构建6个短周期EMA指标和6个长周期EMA指标。短周期EMA包括3日线、5日线、8日线、10日线、12日线和15日线。长周期EMA包括30日线、35日线、40日线、45日线、50日线和60日线。
然后计算短周期EMA之和(g)和长周期EMA之和(mae)。通过长短周期EMA之差(gmae = mae - g)形成格林美差值指标。该差值指标可以判断价格趋势。
当差值上穿0轴时,表示短期均线上升速度快于长期均线,属于多头信号,做多;当差值下穿0轴时,表示短期均线下降速度快于长期均线,属于空头信号,做空。
策略优势
- 使用双EMA均线策略,可以有效跟踪短期趋势
- 构建多组EMA,避免假突破,提高信号准确率
- 差值指标直观判断长短期趋势关系
- 简单参数设置,容易实盘操作
策略风险
- 短周期操作,存在一定止损风险
- 多组EMA参数设置需要测试优化
- 只适合短线操作,不适合持续长线
策略优化
- 测试优化EMA参数,提高交易效率
- 增加止损策略,控制单笔损失
- 结合其他指标过滤入场信号
- 优化资金管理,调整仓位管理
总结
本策略通过构建格林美差值指标,捕捉短期价格趋势变化,属于短线跟踪策略。优点是反应灵敏,适合高频交易。缺点是对市场变量敏感,止损风险较大。整体而言,该策略表现出色,值得在实盘中测试和应用。
策略源码
/*backtest
start: 2023-12-03 00:00:00
end: 2024-01-02 00:00:00
period: 1h
basePeriod: 15m
exchanges: [{"eid":"Futures_Binance","currency":"BTC_USDT"}]
*/

//@version=2
strategy(title="GMAE Original (By Kevin Manrrique)", overlay=false)
/// This indicator was built and scripted by Kevin Manrrique. Please leave this copyright to the script at all times, if rebuilt please add your name onto the script.
/// If you have any questions, please message me directly. Thank you.
/// Sincerely,
///
/// Kevin Manrrique

            ///ONE///
len = input(3, minval=1, title="Length")
src = input(close, title="Source")
out = ema(src, len)
//plot(out, title="EMA", color=blue)

len2 = input(5, minval=1, title="Length")
src2 = input(close, title="Source")
out2 = ema(src2, len2)
//plot(out2, title="EMA", color=blue)

len3 = input(8, minval=1, title="Length")
src3 = input(close, title="Source")
out3 = ema(src3, len3)
//plot(out3, title="EMA", color=blue)

len4 = input(10, minval=1, title="Length")
src4 = input(close, title="Source")
out4 = ema(src4, len4)
//plot(out4, title="EMA", color=blue)

len5 = input(12, minval=1, title="Length")
src5 = input(close, title="Source")
out5 = ema(src5, len5)
//plot(out5, title="EMA", color=blue)

len6 = input(15, minval=1, title="Length")
src6 = input(close, title="Source")
out6 = ema(src6, len6)
//plot(out6, title="EMA", color=blue)
        ///TWO///
len7 = input(30, minval=1, title="Length")
src7 = input(close, title="Source")
out7 = ema(src7, len7)
//plot(out7, title="EMA", color=red)

len8 = input(35, minval=1, title="Length")
src8 = input(close, title="Source")
out8 = ema(src8, len8)
//plot(out8, title="EMA", color=red)

len9 = input(40, minval=1, title="Length")
src9 = input(close, title="Source")
out9 = ema(src9, len9)
//plot(out9, title="EMA", color=red)

len10 = input(45, minval=1, title="Length")
src10 = input(close, title="Source")
out10 = ema(src10, len10)
//plot(out10, title="EMA", color=red)

len11 = input(50, minval=1, title="Length")
src11 = input(close, title="Source")
out11 = ema(src11, len11)
//plot(out11, title="EMA", color=red)

len12 = input(60, minval=1, title="Length")
src12 = input(close, title="Source")
out12 = ema(src12, len12)
//plot(out12, title="EMA", color=red)

g=out+out2+out3+out4+out5+out6
mae=out7+out8+out9+out10+out11+out12
gmae=mae-g
plot(gmae, style=columns, color=green)
baseline=0
plot(baseline, style=line, color=black)

longCondition = crossover(gmae, baseline)
if (longCondition)
    strategy.entry("long", strategy.long)

shortCondition = crossunder(gmae, baseline)
if (shortCondition)
    strategy.entry("short", strategy.short)