概述
该策略是一个多空顺势交易策略,基于移动平均线的金叉死叉形成交易信号。当快速移动平均线从下方上穿慢速移动平均线时,产生买入信号;当快速移动平均线从上方下穿慢速移动平均线时,产生卖出信号。
策略原理
该策略使用两个移动平均线,分别是20日简单移动平均线和30日简单移动平均线。当20日移动平均线从下方上穿30日移动平均线时,产生买入信号;当20日移动平均线从上方下穿30日移动平均线时,产生卖出信号。
移动平均线本身作为一种趋势指标,能够有效地描绘市场趋势方向。交叉原理使得该策略能够及时捕捉趋势转折点,形成交易信号。20日和30日两个周期长度设置得当,既能反映市场趋势,又不至于过于敏感而产生误信号。
优势分析
该策略优势主要体现在以下几个方面:
- 策略逻辑简单清晰,容易理解和实现,适合初学者学习;
- 顺势交易,避免逆势建仓,可以减少不必要损失;
- 移动平均线本身带有一定过滤作用,可以滤除行情噪音,避免产生误信号;
- 周期参数设置合理,不会过于敏感而影响策略稳定性。
风险分析
该策略主要存在以下风险:
- 行情震荡时,移动平均线交叉频繁,可能产生较多止损单;
- 趋势行情时,移动平均线有滞后性,可能错过部分利润;
- 参数设置不当时,会影响策略稳定性。
对策:
- 调整移动平均线周期,采用三角形移动平均线等技术来平滑曲线,减少交叉频率;
- 辅助其他指标判断趋势,避免在震荡行情中交易;
- 优化参数,寻找最佳参数组合。
优化方向
该策略主要可以从以下几个方面进行优化:
- 尝试不同类型的移动平均线,如加权移动平均线、三角移动平均线等;
- 增加其他技术指标判断,避免在震荡市场中产生交易信号;
- 结合波浪理论、通道理论等技术分析方法判断行情趋势;
- 采用机器学习等模型实时优化参数;
- 结合量化工具,采取止盈止损策略优化资金管理。
总结
移动平均交叉系统是一种简单有效的趋势跟踪策略,原理清晰,容易理解,非常适合初学者学习。该策略主要依靠移动平均线的金叉死叉形成交易信号,通过顺势交易获得利润。可以从多方面进行优化,使策略更加稳定和高效。
策略源码
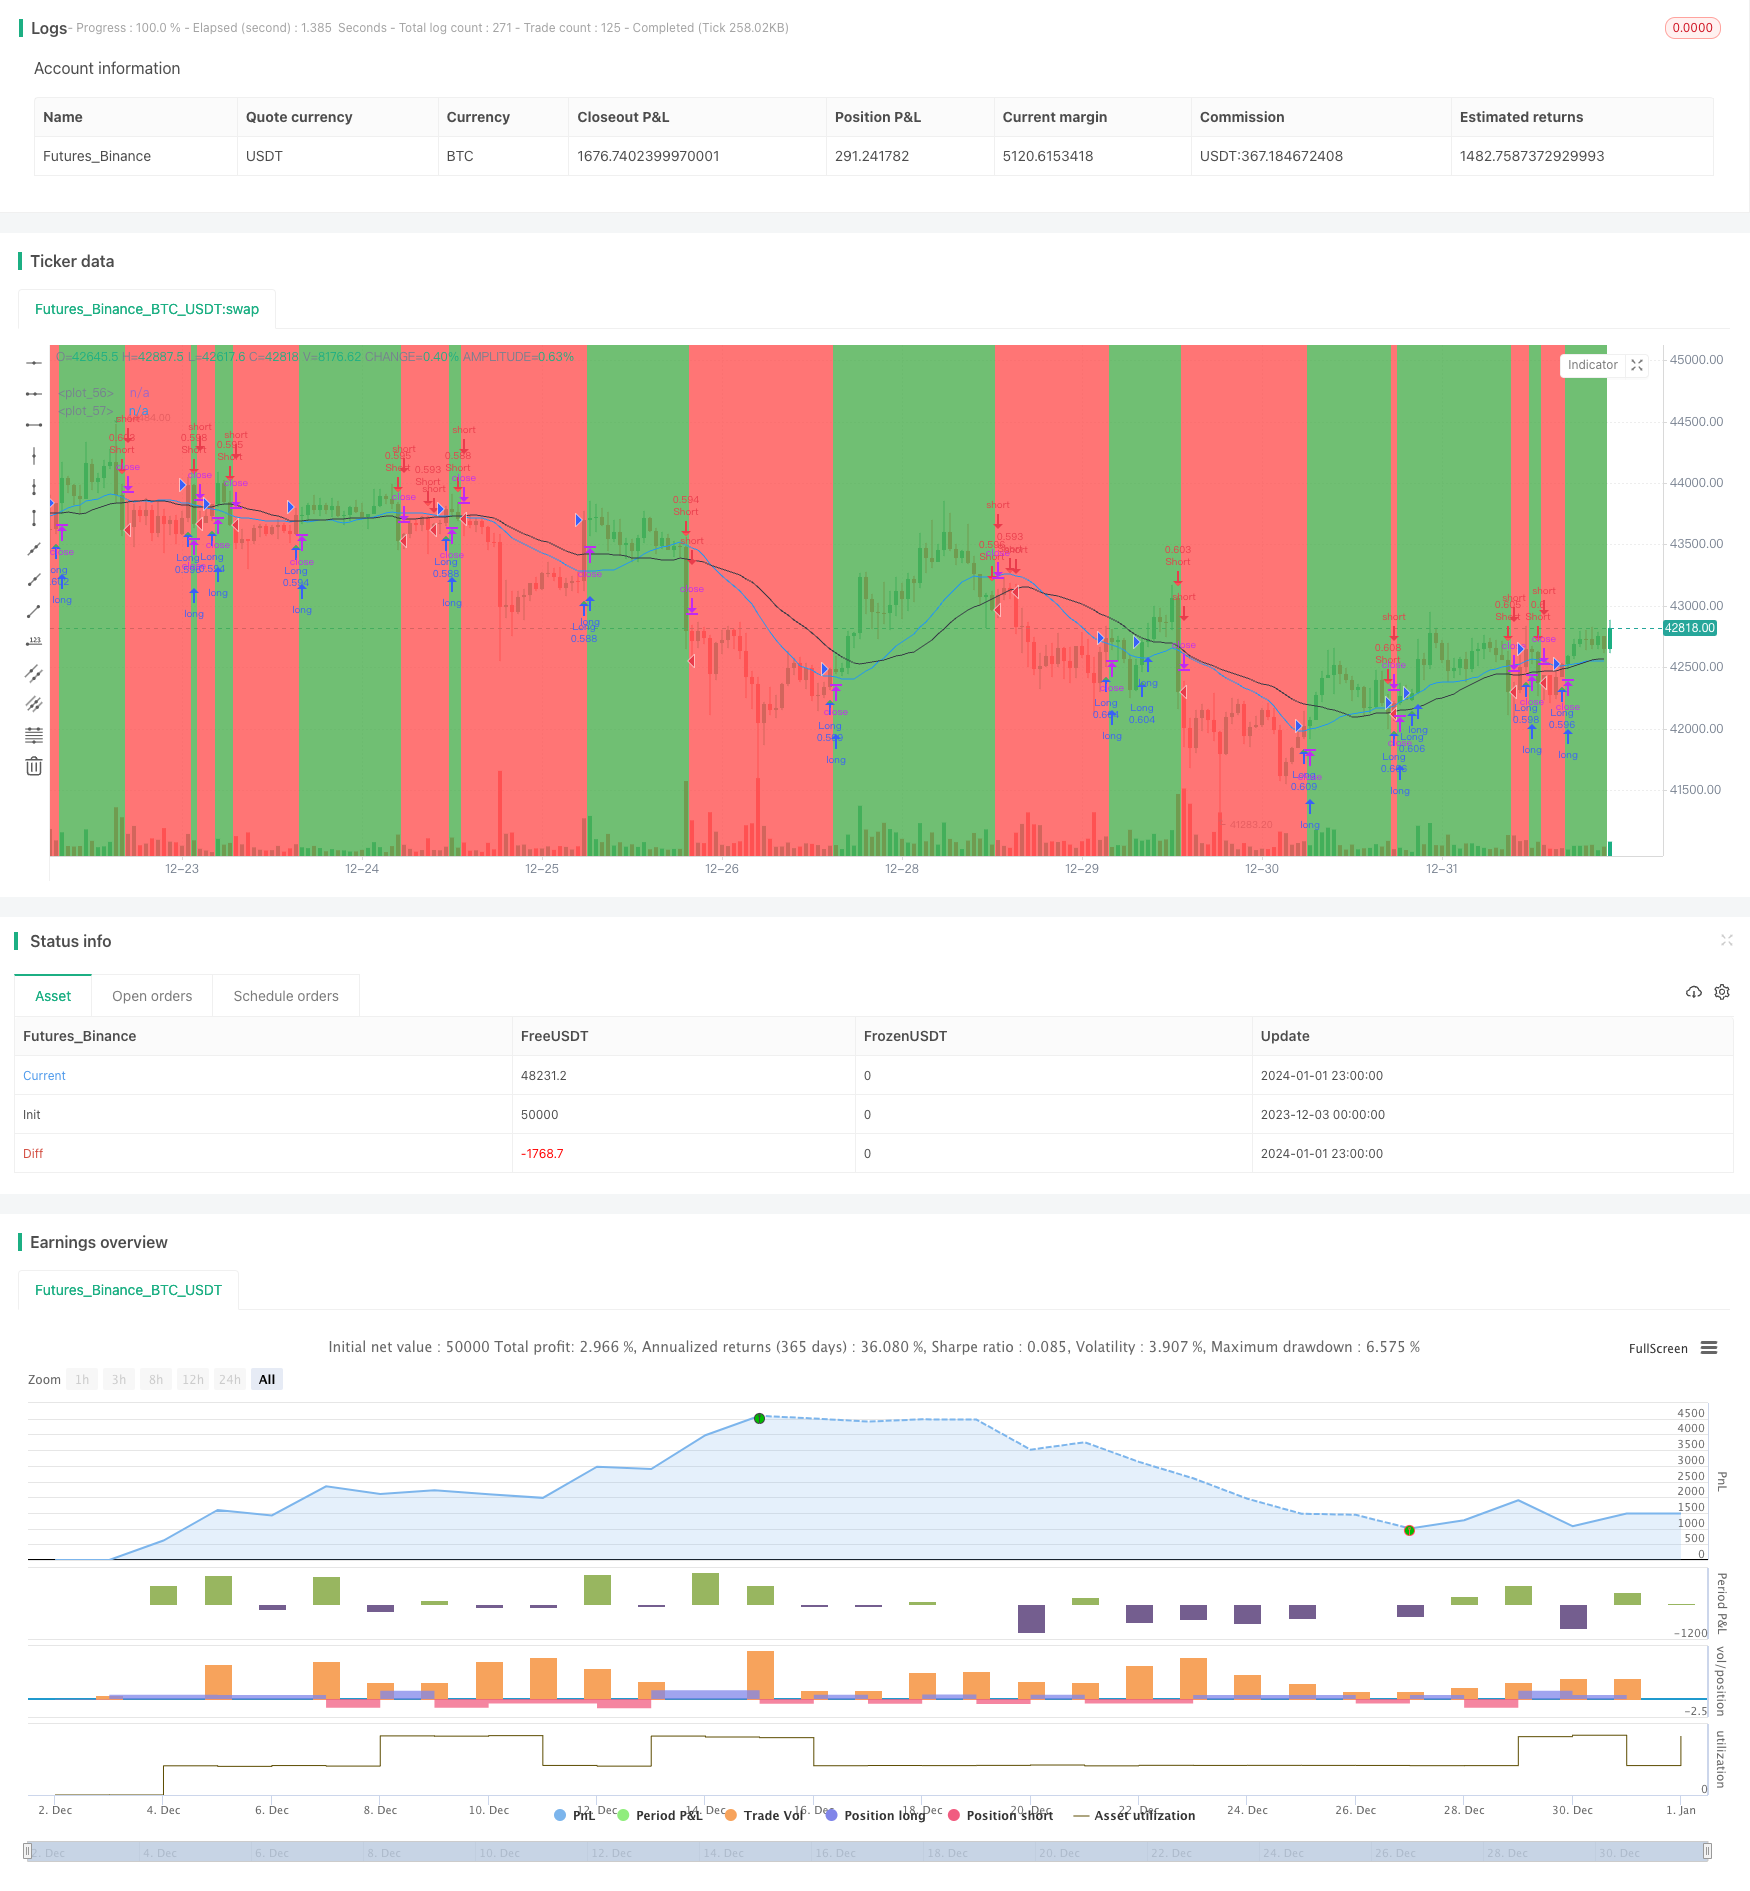
/*backtest
start: 2023-12-03 00:00:00
end: 2024-01-02 00:00:00
period: 1h
basePeriod: 15m
exchanges: [{"eid":"Futures_Binance","currency":"BTC_USDT"}]
*/

// This source code is subject to the terms of the Mozilla Public License 2.0 at https://mozilla.org/MPL/2.0/
// © gliese581d

//@version=4
strategy(title="Moving Averages Testing", overlay=true, precision=2, calc_on_every_tick=false, max_bars_back=5000, pyramiding=2,
 default_qty_type=strategy.percent_of_equity, default_qty_value=50, commission_type=strategy.commission.percent, initial_capital=10000)


//SETTINGS

longs_on = input(title="Long Trades enabled", defval=true)
shorts_on = input(title="Short Trades enabled", defval=true)

long_cond = input(title="Buy/Long Crossover Condition", defval="price x MA1", options=["price x MA1", "price x MA2", "MA1 x MA2"])
short_cond = input(title="Sell/Short Crossunder Condition", defval="price x MA2", options=["price x MA1", "price x MA2", "MA1 x MA2"])

ma1_type = input(title="Moving Average 1 Type", defval="SMA", options=["SMA", "EMA"])
ma1_len = input(defval=20, title="Moving Average 1 Len", type=input.integer, minval=1, maxval=1000, step=1)
ma2_type = input(title="Moving Average 2 Type", defval="SMA", options=["SMA", "EMA"])
ma2_len = input(defval=30, title="Moving Average 2 Len", type=input.integer, minval=1, maxval=1000, step=1)


//MOVING AVERAGES

ma_1 = ma1_type == "EMA" ? ema(close, ma1_len) : sma(close, ma1_len)
ma_2 = ma2_type == "EMA" ? ema(close, ma2_len) : sma(close, ma2_len)


//STRATEGY

//trade entries
long_entry = long_cond == "price x MA1" ? crossover(close, ma_1) : long_cond == "price x MA2" ? crossover(close, ma_2) : long_cond == "MA1 x MA2" ? crossover(ma_1, ma_2) : false
short_entry = short_cond == "price x MA1" ? crossunder(close, ma_1) : short_cond == "price x MA2" ? crossunder(close, ma_2) : short_cond == "MA1 x MA2" ? crossunder(ma_1, ma_2) : false

start_month = input(defval=4, title="Strategy Start Month", type=input.integer, minval=1, maxval=12, step=1)
start_year = input(defval=2018, title="Strategy Start Year", type=input.integer, minval=2000, maxval=2025, step=1)
end_month = input(defval=12, title="Strategy End Month", type=input.integer, minval=1, maxval=12, step=1)
end_year = input(defval=2020, title="Strategy End Year", type=input.integer, minval=2000, maxval=2025, step=1)

in_time =true

strategy.entry("Long", strategy.long, when=longs_on and in_time and long_entry)
strategy.close("Long", when=longs_on and not shorts_on and short_entry)

strategy.entry("Short", strategy.short, when=shorts_on and in_time and short_entry)
strategy.close("Short", when=shorts_on and not longs_on and long_entry)


//PLOTTING

//color background
last_entry_was_long = nz(barssince(long_entry)[1], 5000) < nz(barssince(short_entry)[1], 5000)
bgcol = (longs_on and last_entry_was_long) ? color.green : (shorts_on and not last_entry_was_long) ? color.red : na
bgcolor(color=bgcol, transp=90)

plot((long_cond == "price x MA1" or long_cond == "MA1 x MA2") or (short_cond == "price x MA1" or short_cond == "MA1 x MA2") ? ma_1 : na, color=color.blue)
plot((long_cond == "price x MA2" or long_cond == "MA1 x MA2") or (short_cond == "price x MA2" or short_cond == "MA1 x MA2") ? ma_2 : na, color=color.black)
plotshape(long_entry, style=shape.triangleup, location=location.belowbar, color=color.green)
plotshape(short_entry, style=shape.triangledown, location=location.abovebar, color=color.red)