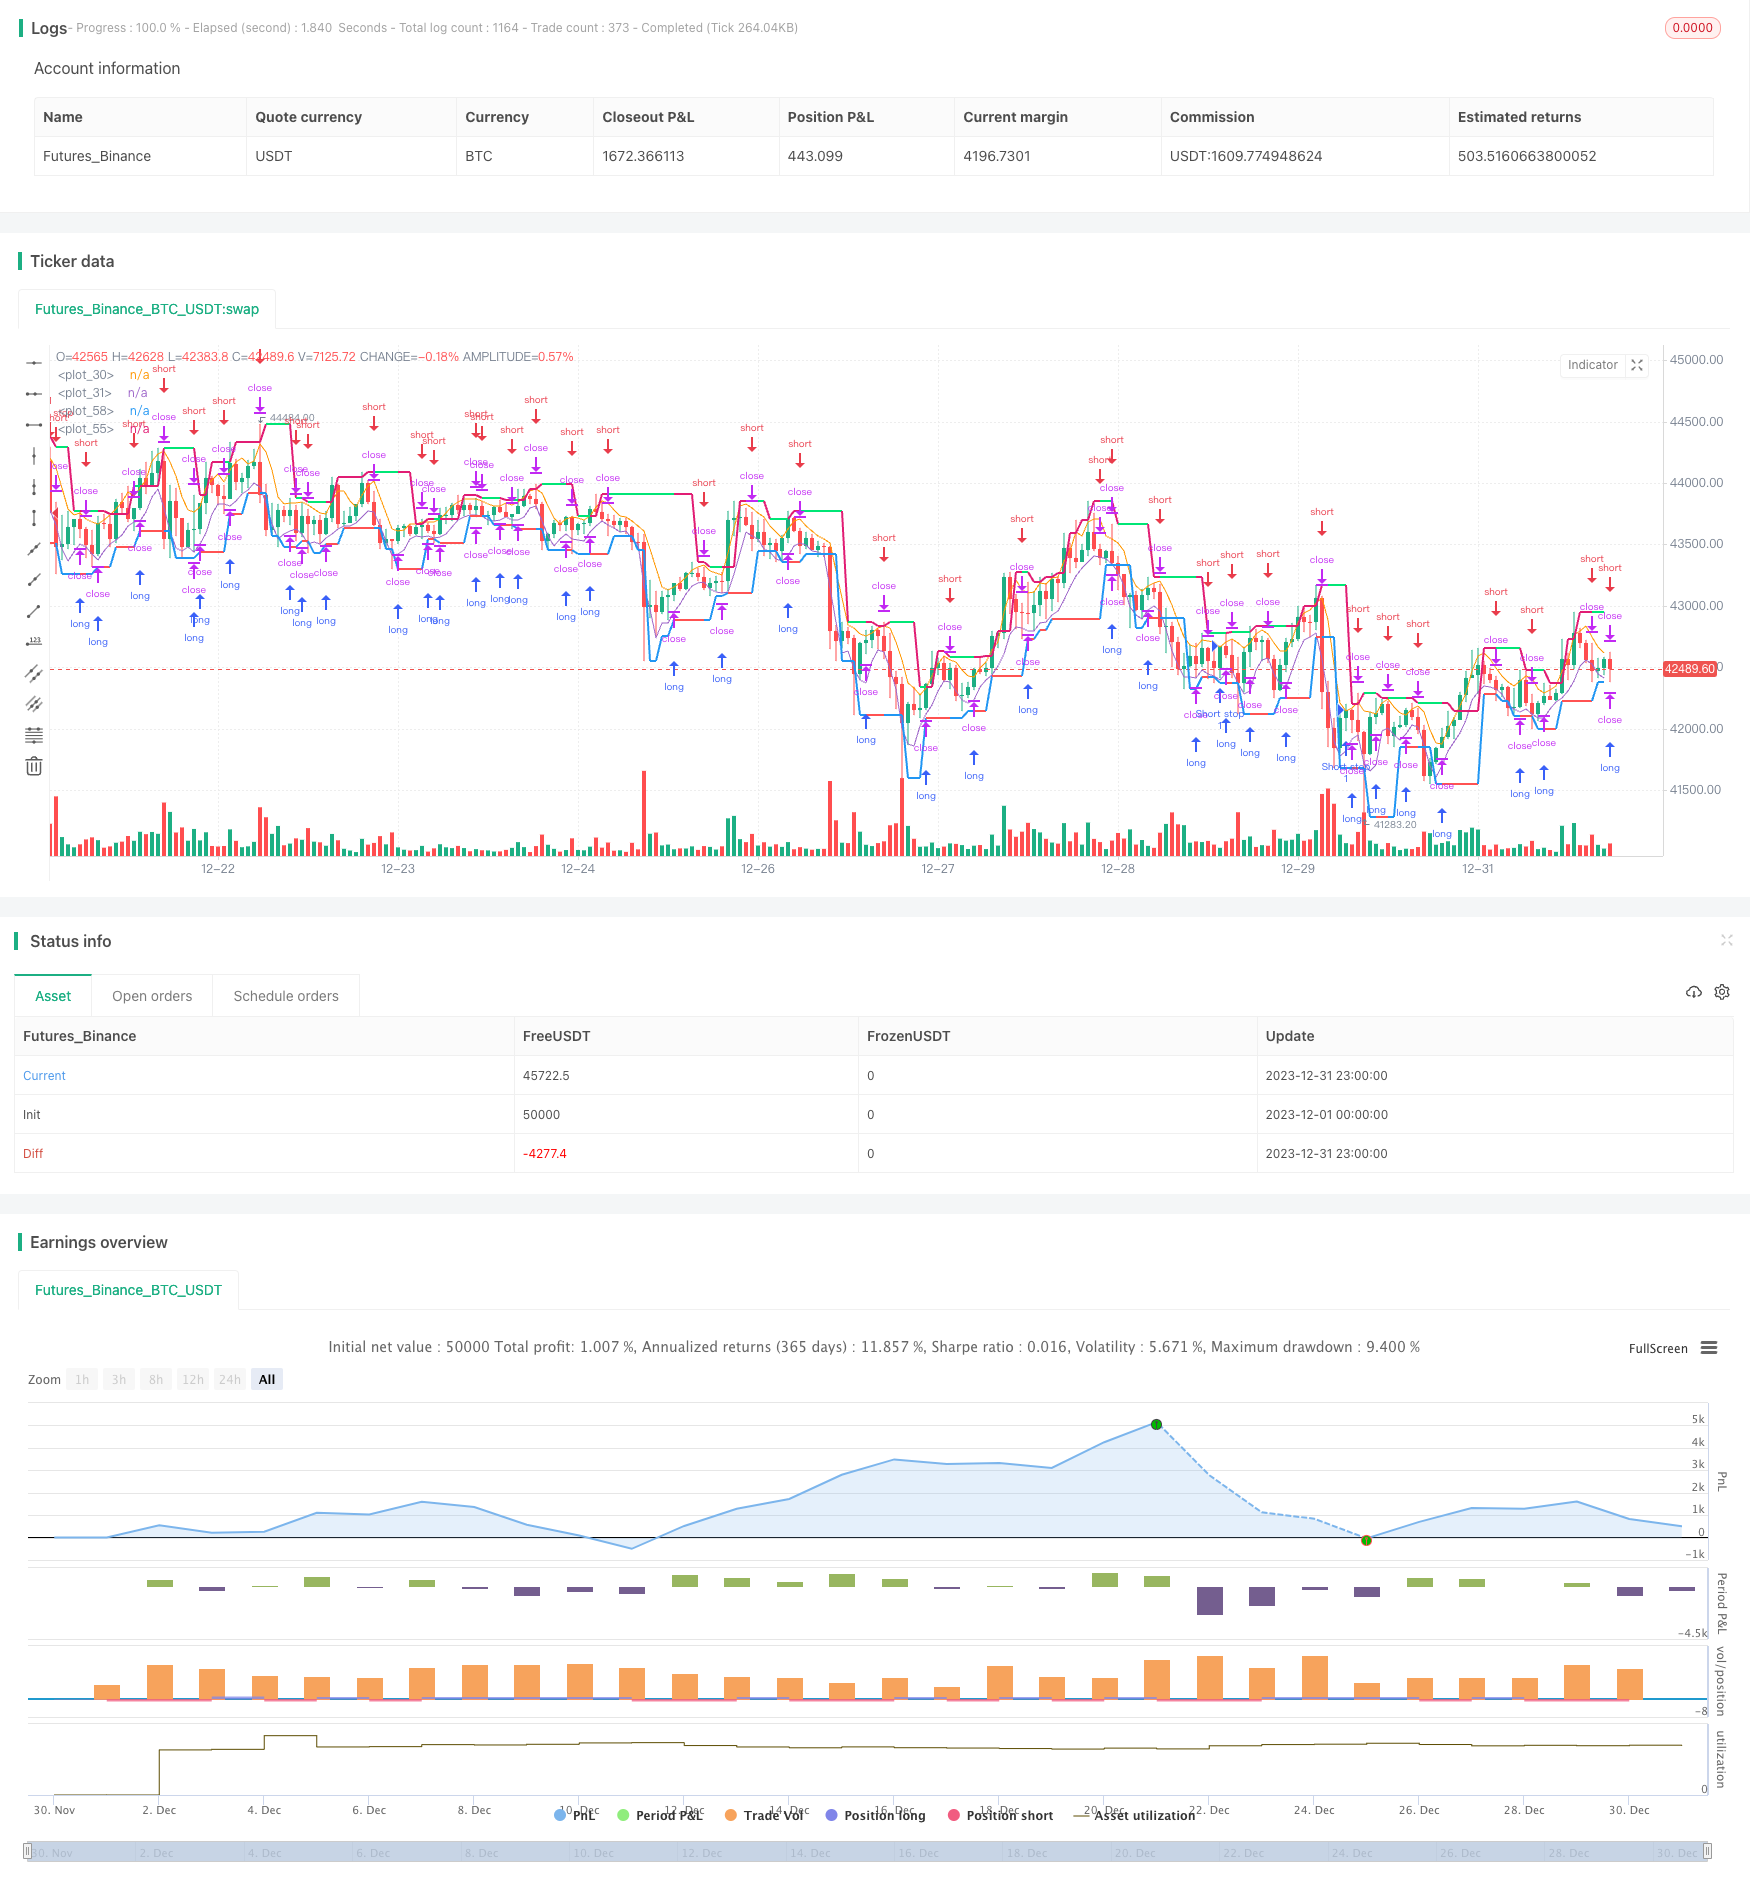
概述
趋势追踪反转策略是一种基于移动平均线和价格极值的趋势交易策略。该策略运用两个移动平均线追踪价格趋势,在趋势反转时打开反向头寸。同时,它还会根据最近几根K线的最高价和最低价计算出价格通道,在价格接近通道边界时设置止损,进一步控制风险。
策略原理
该策略使用长度为3的高点和低点移动平均线hma和lma来追踪价格趋势。当价格上穿hma时,Interpret为看涨;当价格下穿lma时,Interpret为看跌。
该策略还会根据最近bars根K线内的最高价和最低价计算出价格通道的上下轨uplevel和dnlevel。uplevel在最近bars根K线内最高价的基础上往上加一个回调系数corr;dnlevel在最近bars根K线内最低价的基础上往下减一个回调系数corr。这构成了价格的通道范围。
在打开多单时,止损价格为通道上轨;打开空单时,止损价格为通道下轨。这可以有效控制价格反转带来的亏损风险。
当反向信号出现时,该策略会立即反向开仓,追踪新的价格趋势。这就是追踪反转原理。
策略优势
- 该策略充分利用了移动平均线追踪趋势的优势,能快速捕捉价格趋势;
- 应用价格通道和反向开仓来控制风险,有效锁定盈利;
- 策略逻辑简单清晰,容易理解和实现;
- 可自定义参数如趋势判断长度、回调系数等,适应不同品种;
- 支持同向加仓,可充分捕捉趋势机会。
策略风险
- 价格震荡期容易产生错误信号;
- 趋势反转不一定会触发止损,最大亏损无法控制;
- 参数设置不当可能导致过于灵敏或者迟钝;
- 需选择合适的品种和时间段,效果才佳。
优化方法:
1. 结合其他指标过滤无效信号;
2. 增加移动止损来锁定盈利,缩小最大回撤;
3. 针对不同品种和周期进行参数测试和优化。
策略优化方向
该策略还有进一步优化的空间:
可以引入其他指标组合 filtrate掉some无效信号。例如MACD,KD等。
可以加入 adaptive 止损逻辑,例如移动止损、余额止损 等,进一步控制风险。
可以测试不同参数对策略效果的影响,优化参数组合。例如MA周期长度、回调系数大小等。
策略当前是分时段交易的,也可以调整为全天候交易。这可能需要其他过滤规则。
总结
该策略整体来说是一个采用价格通道与移动平均线结合的趋势反转交易策略。通过追踪趋势和及时反转开仓,能有效跟踪价格走势。同时,价格通道和反向开仓的风险控制手段也使其能够有效控制单笔亏损。该策略思路简单明晰,值得在实盘中进一步测试优化。
/*backtest
start: 2023-12-01 00:00:00
end: 2023-12-31 23:59:59
period: 1h
basePeriod: 15m
exchanges: [{"eid":"Futures_Binance","currency":"BTC_USDT"}]
*/

//Noro
//2019

//@version=3
strategy(title = "Noro's 3Bars Strategy by Larry Williams", shorttitle = "3Bars", overlay = true, default_qty_type = strategy.percent_of_equity, default_qty_value = 100, pyramiding = 0)

//Settings
needlong = input(true, defval = true, title = "Long")
needshort = input(true, defval = true, title = "Short")
capital = input(100, defval = 100, minval = 1, maxval = 10000, title = "Capital, %")
corr = input(0.0, title = "Correction, %")
bars = input(1, minval = 1)
revers = input(false, defval = false, title = "revers")
showll = input(true, defval = true, title = "Show Levels")
showos = input(true, defval = true, title = "Show Levels one side")
showcl = input(false, defval = false, title = "Show Levels continuous line")
showbg = input(false, defval = false, title = "Show Background")
showar = input(false, defval = false, title = "Show Arrows")
fromyear = input(1900, defval = 1900, minval = 1900, maxval = 2100, title = "From Year")
toyear = input(2100, defval = 2100, minval = 1900, maxval = 2100, title = "To Year")
frommonth = input(01, defval = 01, minval = 01, maxval = 12, title = "From Month")
tomonth = input(12, defval = 12, minval = 01, maxval = 12, title = "To Month")
fromday = input(01, defval = 01, minval = 01, maxval = 31, title = "From day")
today = input(31, defval = 31, minval = 01, maxval = 31, title = "To day")

len = input(3)

hma = sma(high, len)
lma = sma(low, len)
plot(hma)
plot(lma)

//Levels
hbar = 0
hbar := high > high[1] ? 1 : high < high[1] ? -1 : 0
lbar = 0
lbar := low > low[1] ? 1 : low < low[1] ? -1 : 0
uplevel = 0.0
dnlevel = 0.0
hh = highest(high, bars + 1)
ll = lowest(low, bars + 1)
uplevel := hbar == -1 and sma(hbar, bars)[1] == 1 ? hh + ((hh / 100) * corr) : uplevel[1]
dnlevel := lbar == 1 and sma(lbar, bars)[1] == -1 ? ll - ((ll / 100) * corr) : dnlevel[1]

//Background
size = strategy.position_size
trend = 0
trend := size > 0 ? 1 : size < 0 ? -1 : high >= uplevel ? 1 : low <= dnlevel ? -1 : trend[1]
col = showbg == false ? na : trend == 1 ? lime : trend == -1 ? red : na
bgcolor(col)

//Lines
upcol = na
upcol := showll == false ? na : uplevel != uplevel[1] and showcl == false ? na : showos and trend[1] == 1 ? na : lime
plot(uplevel, color = upcol, linewidth = 2)
dncol = na
dncol := showll == false ? na : dnlevel != dnlevel[1] and showcl == false ? na : showos and trend[1] == -1 ? na : red
plot(dnlevel, color = dncol, linewidth = 2)

//Arrows
longsignal = false
shortsignal = false
longsignal := size > size[1]
shortsignal := size < size[1]
plotarrow(longsignal and showar and needlong ? 1 : na, colorup = blue, colordown = blue, transp = 0)
plotarrow(shortsignal and showar and needshort ? -1 : na, colorup = blue, colordown = blue, transp = 0)

//Trading
lot = 0.0
lot := size != size[1] ? strategy.equity / close * capital / 100 : lot[1]
if uplevel > 0 and dnlevel > 0 and revers == false
    strategy.entry("Long", strategy.long, needlong == false ? 0 : lot, stop = uplevel)
    strategy.entry("Long stop", strategy.short, 0, stop = lma)
    strategy.entry("Short", strategy.short, needshort == false ? 0 : lot, stop = dnlevel)
    strategy.entry("Short stop", strategy.long, 0, stop = hma)

// if time > timestamp(toyear, tomonth, today, 23, 59)
//     strategy.close_all()